背景
看到公众号上的文章:https://mp.weixin.qq.com/s/3CX8Ce5RVtWJ10FqIxo9Bg fluentbit支持采集以下监控指标metrics:
- Node Exporter 指标采集
- Prometheus Scrape 指标采集
- Fluent Bit 指标采集
- Prometheus 远程写入的输出信息采集
- OpenTelemetry 输出采集
所以可以将Node Expoter替换为FluentBit,使用更轻量的Fluent Bit Node Exporter Metrics 插件来替代,同时使用Fluent Bit Prometheus Scrape Metrics插件来收集工作负载的metrics。
这个架构的优点是只需要部署一个组件Fluent Bit,就可以同时收集日志和监控指标,对于资源紧张的节点来说,这是一个非常完美的方案。遂在自己的环境中测试了一下,也有一些坑,记录一下。
如何暴露metrics
问题1:没有部署Edged
公众号中的环境是KubeEdge,KubeEdge的边缘节点中跑了个类似kubelet的组件叫Edged,Edged会暴露Prometheus格式的监控指标,暴露方式和kubelet保持一致,格式是:127.0.0.1:10350/metrics/cadvisor。
我的环境中没有这个组件,所以需要其他的组件来暴露metrics。
问题2:Prometheus Scrape Metrics不支持tls
prometheusScrapeMetrics只支持以下几个参数:
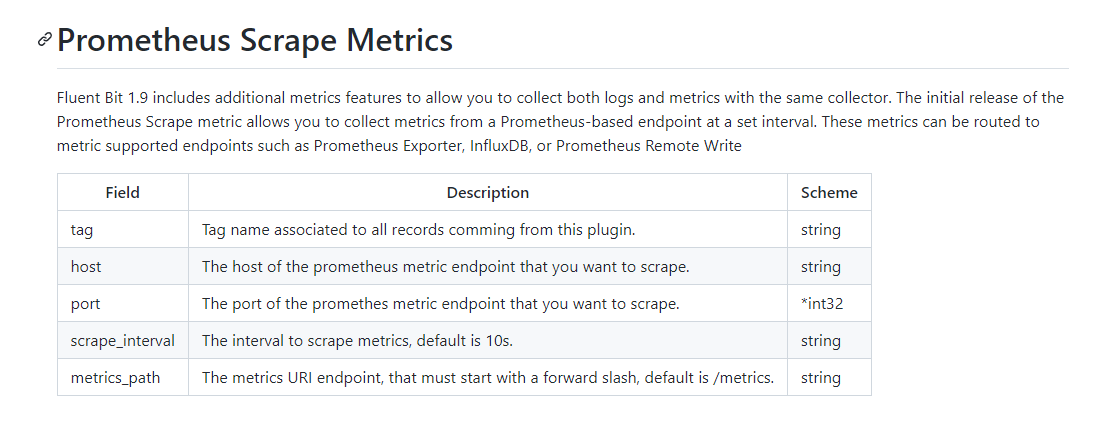
而cadvisor已经整合到了kubelet,kubelet的metrics需要https访问,就使用证书,所以无法使用。
解决
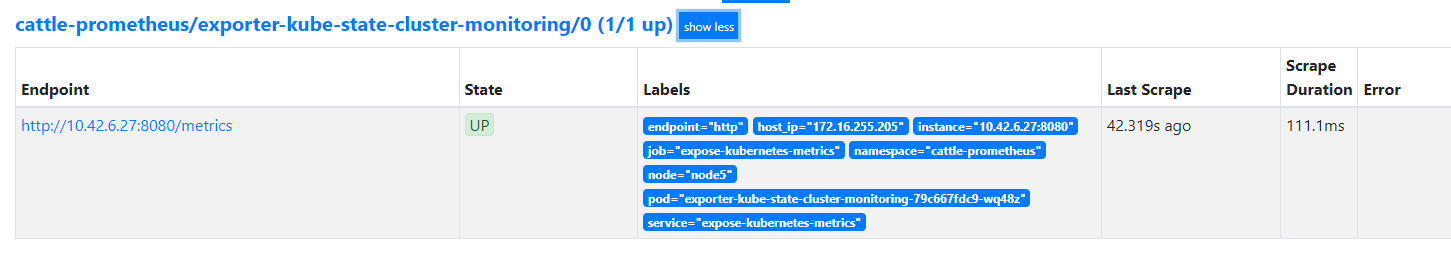
我的环境是导入了rancher中,监控也是在rancher中启动的monitor。查看当前prometheus中的target,想起来可以使用kube-state-metrics的接口来获取metrics。这样既可以获取应用的metrics也可以获取k8s组件相关的metrics。

部署
部署前请先看后面的坑章节,避免重复部署,如果你想踩一遍我的坑,那欢迎
部署prometheus
我使用的是loki-stack中的chart包,只安装prometheus。
helm search repo loki-stack
helm pull grafana/loki-stack
tar xvf loki-stack-2.8.7.tgz
cd loki-stack/charts/prometheus
vim values.yaml
# 将exporter,pushgateway,alertmanager的enable:true都改为false,config-reload不用改
k create ns monitor
helm install prometheus . -n monitor

部署fluentbit
fluentbit需要安装3个插件:
- prometheusScrapeMetrics:获取prometheus格式的metrics
- nodeExporterMetrics:替代node-exporter,,获取节点上的metrics
- prometheusRemoteWrite:把metrics输出到prometheus
- fluentBitMetrics:插件可选,暴露fluentbit自身的metrics,不想监控fluentbit就不用装。
cat fluentbit.yaml

apiVersion: fluentbit.fluent.io/v1alpha2
kind: FluentBit
metadata:
  name: fluentbit
  namespace: elastic # 最好和fluent-operator在一个ns
  labels:
    app.kubernetes.io/name: fluent-bit
spec:
  image: kubesphere/fluent-bit:v1.9.9
  positionDB:
    hostPath:
      path: /var/lib/fluent-bit/
  resources:
    requests:
      cpu: 10m
      memory: 25Mi
    limits:
      cpu: 500m
      memory: 200Mi  # 官方的内存太小了,非常容器OOM,可以调大一点
  fluentBitConfigName: fluent-bit-config
  tolerations:
    - operator: Exists
  hostNetwork : true  # 使用主机网络
  volumes:  # node-exporter监控使用的目录,挂载到fluentbit容器中
    - name: host-proc
      hostPath:
        path: /proc/
    - name: host-sys
      hostPath:
        path: /sys/
  volumesMounts:
    - mountPath: /host/sys
      mountPropagation: HostToContainer
      name: host-sys
      readOnly: true
    - mountPath: /host/proc
      mountPropagation: HostToContainer
      name: host-proc
      readOnly: true
---
apiVersion: fluentbit.fluent.io/v1alpha2
kind: ClusterFluentBitConfig
metadata:
  name: fluent-bit-config
  labels:
    app.kubernetes.io/name: fluent-bit
spec:
  service:
    parsersFile: parsers.conf
  inputSelector:
    matchLabels:
      fluentbit.fluent.io/enabled: "true"
      fluentbit.fluent.io/mode: "fluentbit"
  filterSelector:
    matchLabels:
      fluentbit.fluent.io/enabled: "true"
      fluentbit.fluent.io/mode: "fluentbit"
  outputSelector:
    matchLabels:
      fluentbit.fluent.io/enabled: "true"
      fluentbit.fluent.io/mode: "fluentbit"
  service:
    httpListen: 0.0.0.0
    httpPort: 2020  # fluentbit的svc
    httpServer: true
    parsersFile: parsers.conf
---
apiVersion: fluentbit.fluent.io/v1alpha2
kind: ClusterInput
metadata:
  name: prometheus-scrape-metrics
  labels:
    fluentbit.fluent.io/enabled: "true"
    fluentbit.fluent.io/mode: "fluentbit"
spec:
  prometheusScrapeMetrics:
    tag: metrics.*
    host: 10.42.6.27  # 这里使用域名无法访问,详情请见上篇fluent-operator部署。
    port: 8080
    scrapeInterval: 30s
    metricsPath : /metrics
---
apiVersion: fluentbit.fluent.io/v1alpha2
kind: ClusterInput
metadata:
  name: fluenbit-metrics
  labels:
    fluentbit.fluent.io/enabled: "true"
    fluentbit.fluent.io/mode: "fluentbit"
spec:
  fluentBitMetrics:
    tag: metrics.*
    scrapeInterval: 30s
    scrapeOnStart: true
---
apiVersion: fluentbit.fluent.io/v1alpha2
kind: ClusterInput
metadata:
  name: node-exporter-metrics
  labels:
    fluentbit.fluent.io/enabled: "true"
    fluentbit.fluent.io/mode: "fluentbit"
spec:
  nodeExporterMetrics:
    tag: metrics.*
    scrapeInterval: 30s
    path :
      procfs: /host/proc
      sysfs : /host/sys
---
apiVersion: fluentbit.fluent.io/v1alpha2
kind: ClusterOutput
metadata:
  name: prometheus-remote-write
  labels:
    fluentbit.fluent.io/enabled: "true"
    fluentbit.fluent.io/mode: "fluentbit"
spec:
  matchRegex: (?:metrics|service)\.(.*)  # 要和上面的tag一致,不然无法输出。
  prometheusRemoteWrite:
   # host: prometheus-server.monitor.svc.cluster.local
    host: 10.42.3.169
    port: 9090
    uri: /api/v1/write  # prometheus RemoteWrite写入数据的api接口
    addLabels :  # metrics添加labels
      app : fluentbit
      job : fluentbit

k apply -f fluentbit.yaml
验证
登陆prometheus ui
按照上面方法安装的prometheus,svc是clusterip,需要修改为nodePort。

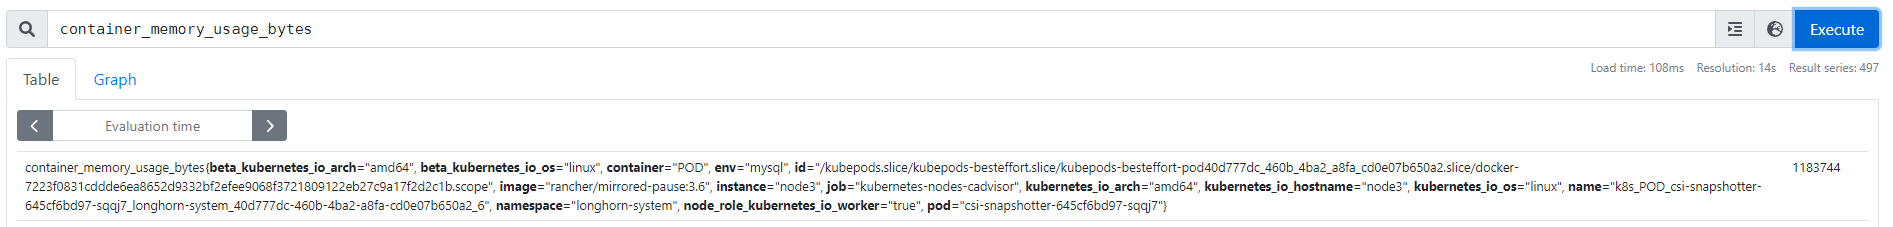
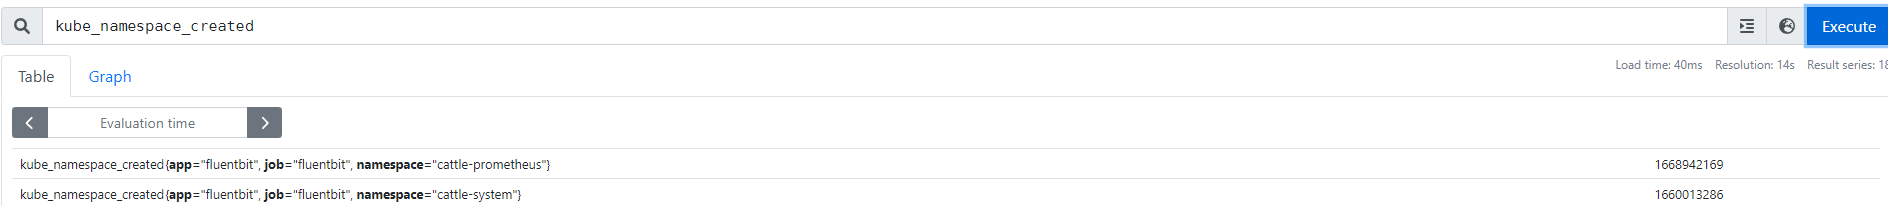
查看prometheus中的数据
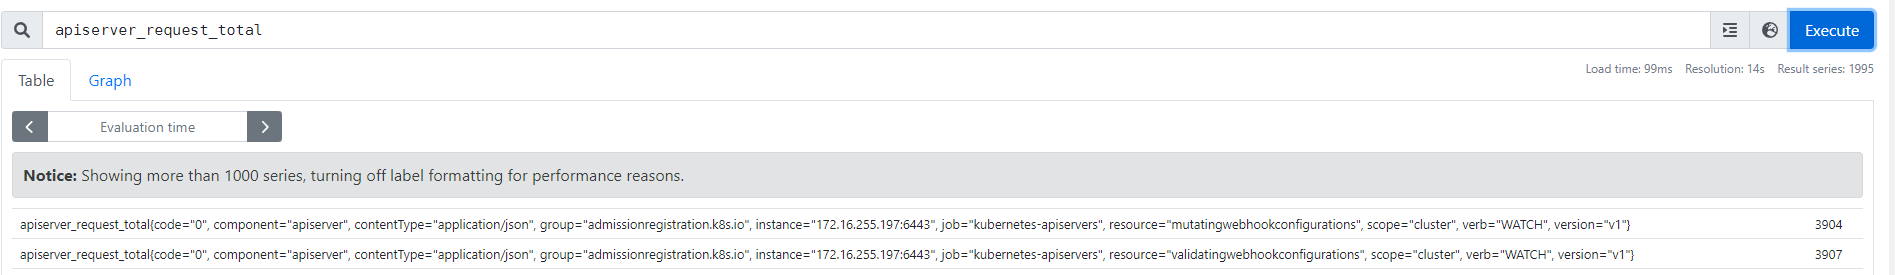
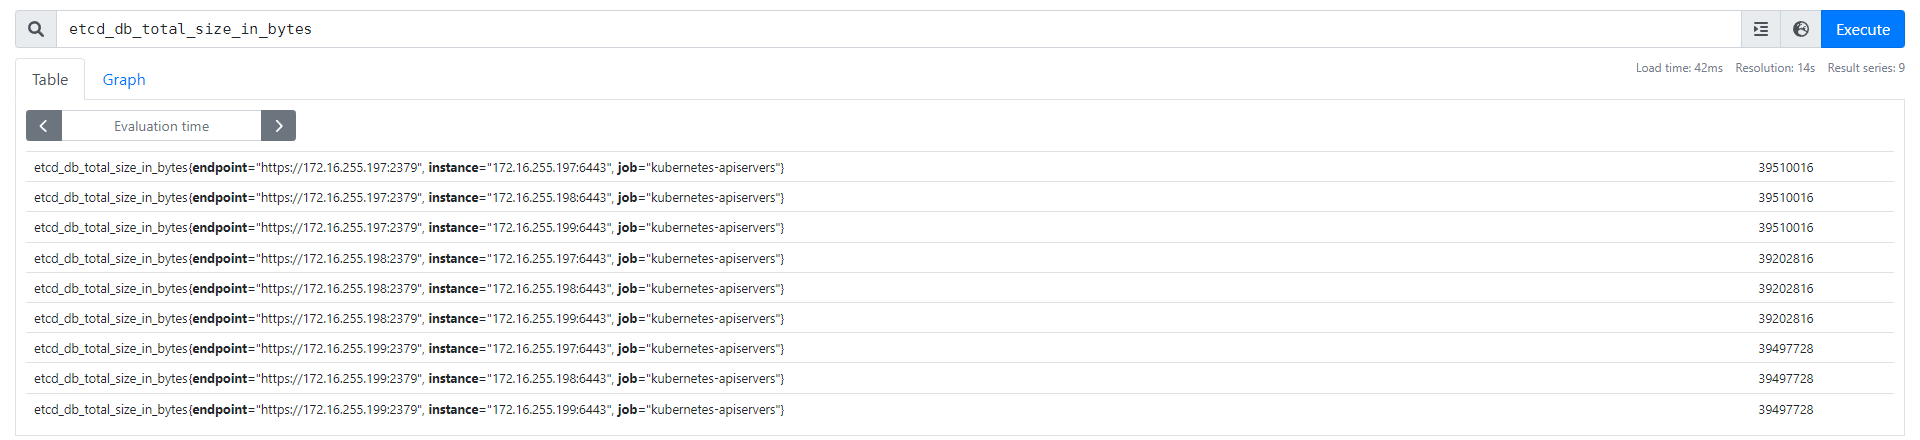
下面列举了几个metrics,证明fluentbit可以代替node-exporter,获取metrics并输出到prometheus。
fluentbit-agent

apiserver
etcd
容器
kube-*


vm/物理机


prometheus

坑
下面介绍一下我在部署验证的过程中遇到的坑。公众号上的环境和我本地的环境相差很大,可能没有我这些问题。我也没搜到有成功输出到prometheus的相关文档,我这里也算第一份了hhh。
一.域名无法访问
这个在fluent-operator部署
中也说过,fluentbit无法访问域名,报错:no upstream 或者 connection timeout。
解决
将host中的域名换成pod的ip。最开始一段时间没问题,但也会出问题。连接ip也timeout,重启fluentbit即可。

二.prometheus未开启RemoteWrite
fluentbit报错如下:
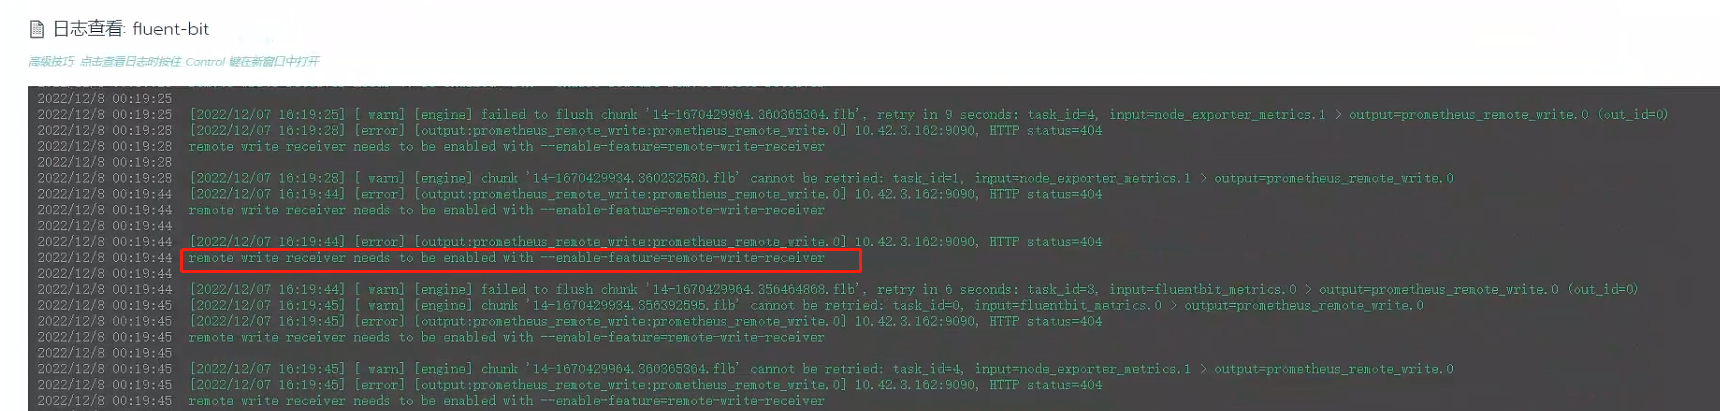
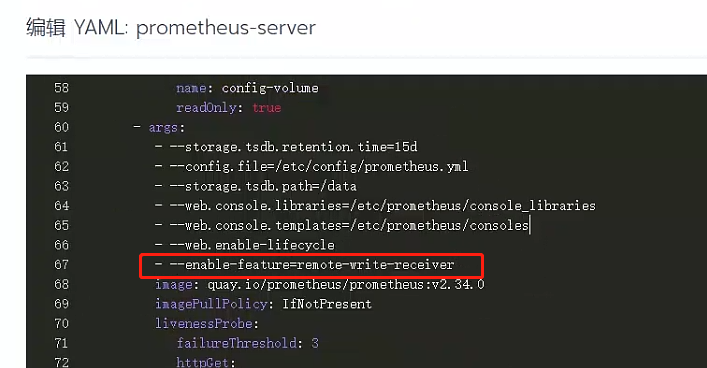
解决
RemoteWrite是一个feature,需要在启动命令中手动enable,修改yaml重启prometheus即可。

三.prometheus报错out of order sample
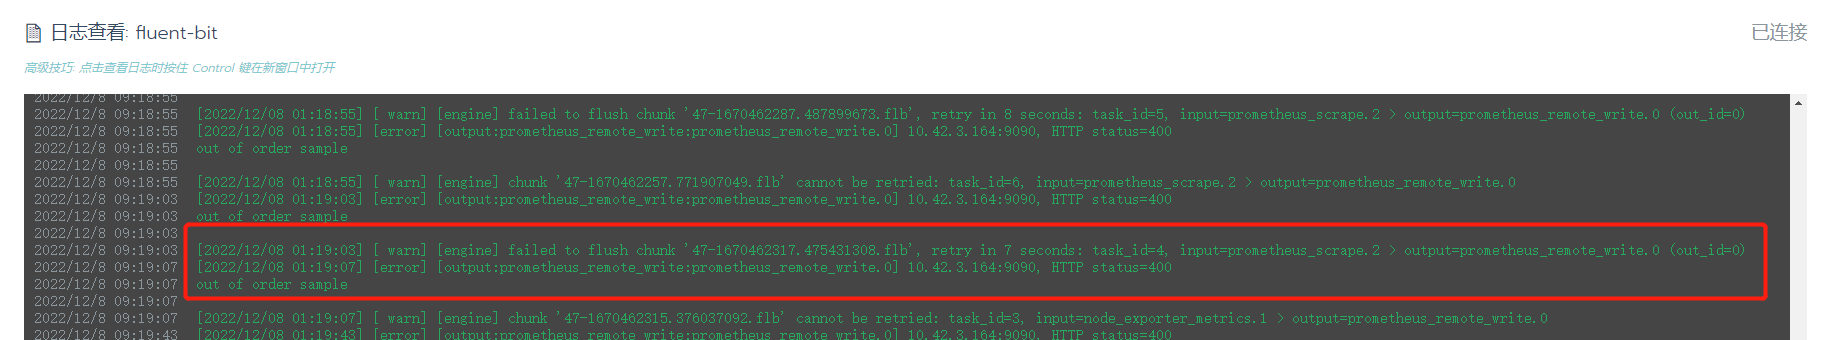
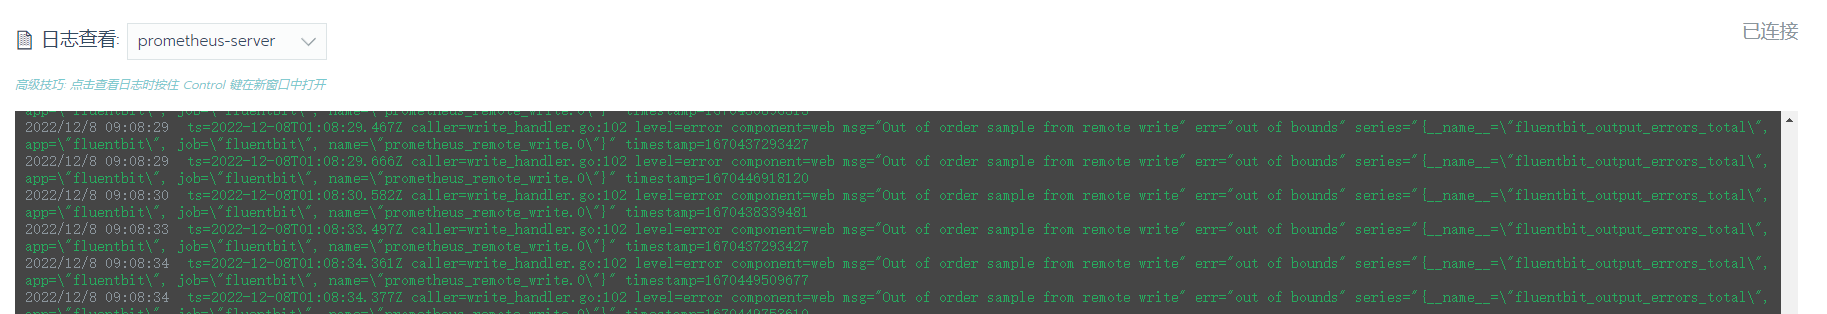
报错原因
详细分析:https://www.robustperception.io/debugging-out-of-order-samples/
https://docs.google.com/document/d/1Kppm7qL9C-BJB1j6yb6-9ObG3AbdZnFUBYPNNWwDBYM/edit#
出现这个报错的原因一般是时间没有同步,而我这里相关容器的时间都是一致的。或者有多个agent暴露一个metrics。
而我的fluentbit是ds方式部署的,多个fluentbit同时工作,然后通过prometheusScrapeMetrics插件的api接口获取数据,所以每个fluentbit都会获取这个metrics的数据。所以就可能出现时序不对的情况。
解决
-
参考:
https://github.com/prometheus/prometheus/issues/11496https://github.com/prometheus/prometheus/issues/9218

由issue中得知,在prometheus v2.39.0以上的版本增加了
out-of-order支持。我当前的prometheus版本是2.34.0,所以需要先升级prometheus。 -
我这里用的是最新的2.40.5,修改镜像重新部署。
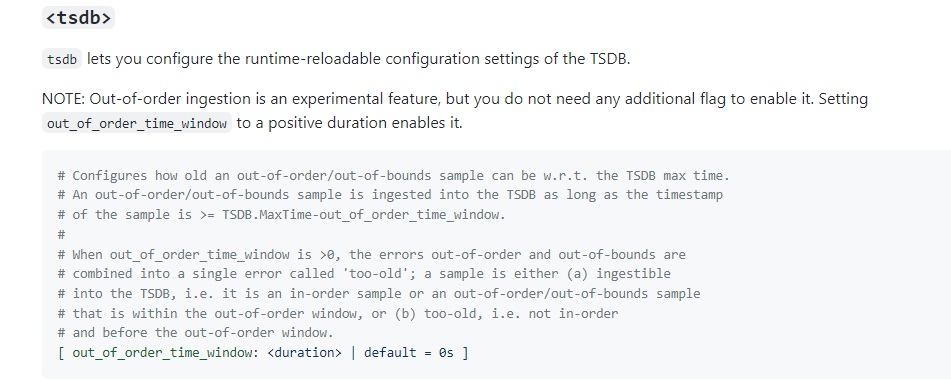
然后需要修改prometheus的配置文件,先查看
out_of_order配置方式:
-
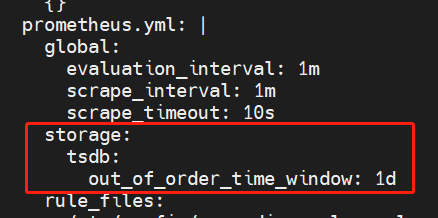
修改promeprometheus的cm,增加配置
k edit cm -n monitor prometheus-server

storage:
  tsdb:
    out_of_order_time_window: 1d
这里就体现出config-reload的好处了,不用重启prometheus。
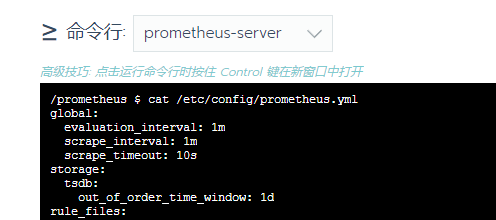
查看prometheus的配置文件已自动更新。
-
重新部署fluentbit
由于修改了prometheus的镜像,pod的ip发生了变化,而fluentbit中output的host指定的是原来prometheus pod的ip,所以需要修改ip地址重新部署。k delete -f fluentbit.yaml k apply -f fluentbit.yaml