背景
我环境中同时使用了eureka和nacos两个注册中心,两个注册中心之间是通过nacos-sync同步数据的。这就有个问题,一旦nacos-sync挂了,数据就会不一致,服务可能就会报错。所以需要给nacos-sync加一个监控告警。
- Nacos-Sync 0.4.8
- NACOS 2.5.2
实现
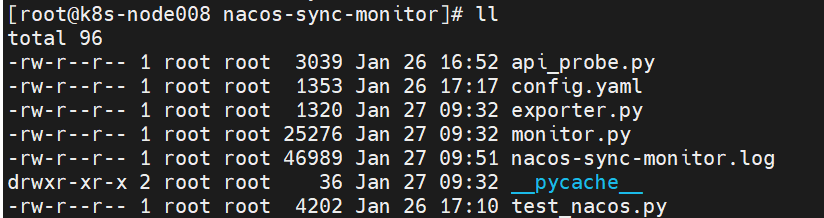
通过python脚本实现,分为几个文件:
config.yaml
# Nacos-Sync 监控配置文件

# Nacos-Sync 集群配置
nacos_sync:
  nodes:
    - http://1.2.3.4:6666
  # API 端点(根据实际情况调整)
  api_base: /nacosSync/v1
  check_interval: 10  # 检查间隔(秒)

# Nacos 配置
nacos:
  server_addr: http://1.2.3.4:7777
  namespace: test
  username: nacos
  password: nacos

# Eureka 配置
eureka:
  server_addr: http://1.2.3.4:8888

# 钉钉告警配置
dingtalk:
  enabled: true
  webhook: "https://oapi.dingtalk.com/robot/send?access_token=xxxxxx"
  secret: "xxxxxx"  # 如果启用了签名验证
  at_mobiles: ["12345678900"]  # @指定人的手机号
  is_at_all: false

# Prometheus Exporter 配置
prometheus:
  enabled: true
  port: 9090
  metrics_path: /metrics

# 监控规则配置
monitoring:
  # 同步任务状态检查
  sync_task_check:
    enabled: true
    alert_on_fail: true

  # 服务实例数量差异检查
  instance_count_check:
    enabled: true
    threshold: 0.1  # 10% 差异触发告警

  # 同步延迟检查
  sync_delay_check:
    enabled: true
    threshold: 300  # 5分钟

# 日志配置
logging:
  level: INFO
  file: /var/log/nacos-sync-monitor.log
  max_bytes: 10485760  # 10MB
  backup_count: 5
api_probe.py
#!/usr/bin/env python3
# -*- coding: utf-8 -*-
"""
Nacos-Sync API 探测脚本
用于发现 Nacos-Sync 的实际 API 端点
"""
import requests
import json
from urllib.parse import urljoin
# Nacos-Sync 地址
NACOS_SYNC_URL = "http://1.2.3.4:6666"
print("=" * 60)
print("Nacos-Sync API 探测工具")
print(f"目标地址: {NACOS_SYNC_URL}")
print("=" * 60)
# 可能的健康检查端点
health_endpoints = [
"/actuator/health",
"/nacosSync/actuator/health",
"/health",
"/api/health",
"/v1/health",
]
print("\n1. 探测健康检查端点...")
print("-" * 60)
for endpoint in health_endpoints:
url = urljoin(NACOS_SYNC_URL, endpoint)
try:
response = requests.get(url, timeout=5)
print(f"✓ {endpoint}")
print(f" 状态码: {response.status_code}")
if response.status_code == 200:
try:
print(f" 响应: {json.dumps(response.json(), indent=2, ensure_ascii=False)}")
except:
print(f" 响应: {response.text[:200]}")
print()
except Exception as e:
print(f"✗ {endpoint} - {str(e)}")
# 可能的任务列表端点
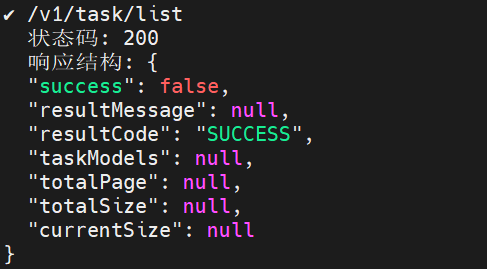
task_endpoints = [
"/v1/sync/task/list",
"/nacosSync/v1/sync/task/list",
"/api/v1/sync/task/list",
"/v1/task/list",
"/nacosSync/v1/task/list",
"/sync/task/list",
]
print("\n2. 探测任务列表端点...")
print("-" * 60)
for endpoint in task_endpoints:
url = urljoin(NACOS_SYNC_URL, endpoint)
try:
response = requests.get(url, timeout=5)
print(f"✓ {endpoint}")
print(f" 状态码: {response.status_code}")
if response.status_code == 200:
try:
data = response.json()
print(f" 响应结构: {json.dumps(data, indent=2, ensure_ascii=False)[:500]}")
except:
print(f" 响应: {response.text[:200]}")
print()
except Exception as e:
print(f"✗ {endpoint} - {str(e)}")
# 探测常见的管理端点
management_endpoints = [
"/",
"/index.html",
"/actuator",
"/nacosSync/actuator",
"/api",
"/v1",
]
print("\n3. 探测管理端点...")
print("-" * 60)
for endpoint in management_endpoints:
url = urljoin(NACOS_SYNC_URL, endpoint)
try:
response = requests.get(url, timeout=5)
print(f"✓ {endpoint}")
print(f" 状态码: {response.status_code}")
print(f" Content-Type: {response.headers.get('Content-Type', 'N/A')}")
if 'json' in response.headers.get('Content-Type', ''):
try:
print(f" 响应: {json.dumps(response.json(), indent=2, ensure_ascii=False)[:300]}")
except:
pass
print()
except Exception as e:
print(f"✗ {endpoint} - {str(e)}")
print("\n" + "=" * 60)
print("探测完成!")
print("=" * 60)
print("\n请查看上面的输出,找到状态码为 200 的端点。")
print("然后将正确的端点路径更新到 config/config.yaml 和 monitor.py 中。")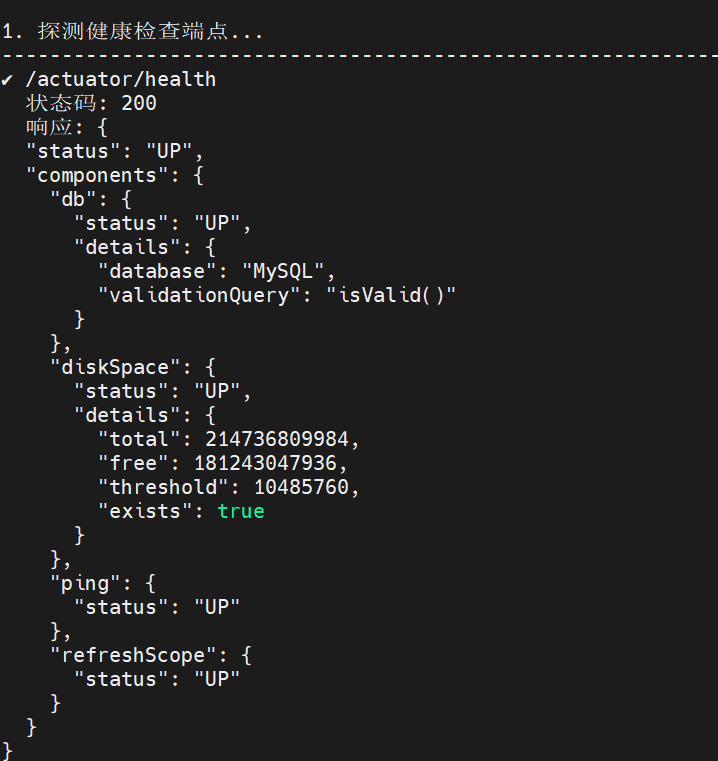
test_nacos.py
Nacos需要先登录获取token,而不是使用 HTTP Basic Auth。
#!/usr/bin/env python3
# -*- coding: utf-8 -*-
"""
测试 Nacos API 连接
用于验证 Nacos 认证和服务查询是否正常
"""
import requests
import yaml
# 读取配置
with open('config.yaml', 'r', encoding='utf-8') as f:
config = yaml.safe_load(f)
nacos_config = config['nacos']
print("=" * 60)
print("Nacos API 连接测试")
print("=" * 60)
print(f"服务地址: {nacos_config['server_addr']}")
print(f"命名空间: {nacos_config['namespace']}")
print(f"用户名: {nacos_config['username']}")
print("=" * 60)
# 1. 测试登录
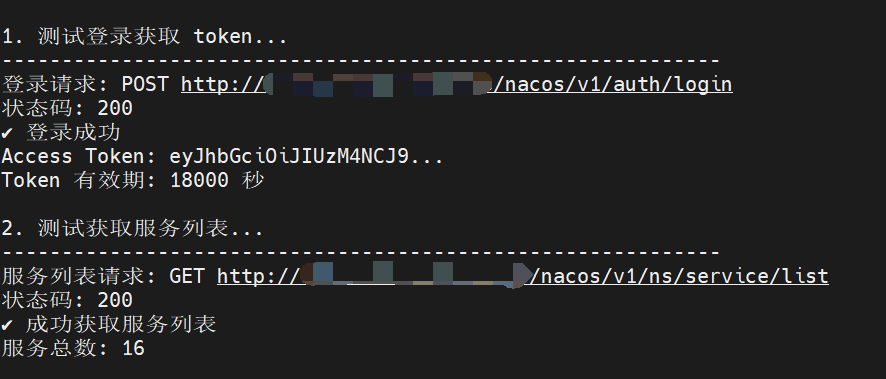
print("\n1. 测试登录获取 token...")
print("-" * 60)
login_url = f"{nacos_config['server_addr']}/nacos/v1/auth/login"
login_data = {
'username': nacos_config['username'],
'password': nacos_config['password']
}
try:
response = requests.post(login_url, data=login_data, timeout=10)
print(f"登录请求: POST {login_url}")
print(f"状态码: {response.status_code}")
if response.status_code == 200:
result = response.json()
token = result.get('accessToken')
print(f"✓ 登录成功")
print(f"Access Token: {token[:20]}..." if token else "无 token")
print(f"Token 有效期: {result.get('tokenTtl', 'N/A')} 秒")
else:
print(f"✗ 登录失败: {response.text}")
token = None
except Exception as e:
print(f"✗ 登录异常: {str(e)}")
token = None
# 2. 测试获取服务列表
if token:
print("\n2. 测试获取服务列表...")
print("-" * 60)
service_list_url = f"{nacos_config['server_addr']}/nacos/v1/ns/service/list"
params = {
'pageNo': 1,
'pageSize': 100,
'namespaceId': nacos_config['namespace'],
'accessToken': token
}
try:
response = requests.get(service_list_url, params=params, timeout=10)
print(f"服务列表请求: GET {service_list_url}")
print(f"状态码: {response.status_code}")
if response.status_code == 200:
data = response.json()
services = data.get('doms', [])
print(f"✓ 成功获取服务列表")
print(f"服务总数: {data.get('count', 0)}")
if services:
print(f"\n前 10 个服务:")
for i, service in enumerate(services[:10], 1):
print(f" {i}. {service}")
# 3. 测试获取第一个服务的实例
if len(services) > 0:
test_service = services[0]
print(f"\n3. 测试获取服务实例: {test_service}")
print("-" * 60)
instance_url = f"{nacos_config['server_addr']}/nacos/v1/ns/instance/list"
instance_params = {
'serviceName': test_service,
'namespaceId': nacos_config['namespace'],
'accessToken': token
}
response = requests.get(instance_url, params=instance_params, timeout=10)
print(f"实例列表请求: GET {instance_url}")
print(f"参数: serviceName={test_service}, namespaceId={nacos_config['namespace']}")
print(f"状态码: {response.status_code}")
if response.status_code == 200:
data = response.json()
hosts = data.get('hosts', [])
print(f"✓ 成功获取实例列表")
print(f"实例数量: {len(hosts)}")
if hosts:
print(f"\n实例详情:")
for i, host in enumerate(hosts[:5], 1):
print(f" {i}. {host.get('ip')}:{host.get('port')} - {host.get('healthy')}")
else:
print(f"✗ 获取实例失败: {response.text}")
else:
print("⚠ 命名空间中没有服务")
else:
print(f"✗ 获取服务列表失败: {response.text}")
except Exception as e:
print(f"✗ 获取服务列表异常: {str(e)}")
print("\n" + "=" * 60)
print("测试完成")
print("=" * 60)
monitor.py
#!/usr/bin/env python3
# -*- coding: utf-8 -*-
"""
Nacos-Sync 监控脚本
功能:
1. 监控 nacos-sync 集群节点健康状态
2. 监控同步任务状态
3. 检查 Nacos 和 Eureka 服务实例一致性
4. 发送钉钉告警
5. 暴露 Prometheus metrics
"""
import time
import requests
import logging
import yaml
import json
from datetime import datetime
from typing import Dict, List, Optional
import traceback
class NacosSyncMonitor:
def __init__(self, config_path: str = "config.yaml"):
"""初始化监控器"""
with open(config_path, 'r', encoding='utf-8') as f:
self.config = yaml.safe_load(f)
self.setup_logging()
self.metrics = {
'nacos_sync_nodes_up': 0,
'nacos_sync_nodes_total': len(self.config['nacos_sync']['nodes']),
'sync_tasks_total': 0,
'sync_tasks_success': 0,
'sync_tasks_failed': 0,
'instance_count_diff': {},
'last_check_timestamp': 0,
'tasks_detail': [], # 每个任务的详细信息
'service_instances': {} # 每个服务的实例数量
}
# Nacos 访问 token(缓存)
self.nacos_token = None
self.nacos_token_expire = 0
def setup_logging(self):
"""配置日志"""
log_config = self.config['logging']
# 清除已有的 handlers,避免重复
for handler in logging.root.handlers[:]:
logging.root.removeHandler(handler)
logging.basicConfig(
level=getattr(logging, log_config['level']),
format='%(asctime)s - %(name)s - %(levelname)s - %(message)s',
handlers=[
logging.FileHandler(log_config['file']),
logging.StreamHandler()
]
)
self.logger = logging.getLogger(__name__)
def check_nacos_sync_nodes(self) -> List[Dict]:
"""检查 nacos-sync 集群节点状态"""
nodes_status = []
up_count = 0
for node_url in self.config['nacos_sync']['nodes']:
try:
# Nacos-Sync 0.4.8 实际端点: /actuator/health
health_url = f"{node_url}/actuator/health"
response = requests.get(health_url, timeout=5)
if response.status_code == 200:
status = 'UP'
response_time = response.elapsed.total_seconds()
up_count += 1
# 解析健康状态详情
try:
health_data = response.json()
overall_status = health_data.get('status', 'UNKNOWN')
components = health_data.get('components', {})
self.logger.debug(f"节点 {node_url} 健康状态: {overall_status}")
nodes_status.append({
'node': node_url,
'status': status,
'response_time': response_time,
'health_status': overall_status,
'db_status': components.get('db', {}).get('status', 'UNKNOWN'),
'disk_status': components.get('diskSpace', {}).get('status', 'UNKNOWN')
})
except:
nodes_status.append({
'node': node_url,
'status': status,
'response_time': response_time
})
else:
status = 'DOWN'
nodes_status.append({
'node': node_url,
'status': status,
'error': f'HTTP {response.status_code}'
})
except Exception as e:
self.logger.error(f"检查节点 {node_url} 失败: {str(e)}")
nodes_status.append({
'node': node_url,
'status': 'DOWN',
'error': str(e)
})
self.metrics['nacos_sync_nodes_up'] = up_count
return nodes_status
def get_sync_tasks(self) -> List[Dict]:
"""获取同步任务列表"""
try:
# Nacos-Sync 0.4.8 实际端点: /v1/task/list
# 响应格式: {success, resultCode, taskModels, totalPage, totalSize, currentSize}
for node_url in self.config['nacos_sync']['nodes']:
try:
api_url = f"{node_url}/v1/task/list"
# 尝试带分页参数
params = {
'pageNum': 1,
'pageSize': 100 # 获取前100个任务
}
self.logger.debug(f"获取任务列表: {api_url}")
response = requests.get(api_url, params=params, timeout=10)
if response.status_code == 200:
data = response.json()
self.logger.debug(f"API 响应: {json.dumps(data, ensure_ascii=False)}")
# Nacos-Sync 0.4.8 响应结构
# {success, resultCode, taskModels, ...}
if isinstance(data, dict):
# 优先使用 taskModels 字段
if 'taskModels' in data and data['taskModels'] is not None:
task_list = data['taskModels']
if isinstance(task_list, list):
self.logger.info(f"成功获取到 {len(task_list)} 个同步任务")
return task_list
# 备用:检查其他可能的字段
for field in ['data', 'tasks', 'taskList']:
if field in data and isinstance(data[field], list):
self.logger.info(f"成功从 {field} 字段获取到 {len(data[field])} 个任务")
return data[field]
# 如果 taskModels 为 null,说明没有任务或需要其他参数
if 'taskModels' in data and data['taskModels'] is None:
result_code = data.get('resultCode', 'UNKNOWN')
result_message = data.get('resultMessage', 'No message')
# resultCode 为 SUCCESS 但 taskModels 为 null 可能表示没有任务
if result_code == 'SUCCESS':
self.logger.info(f"任务列表为空或暂无同步任务")
return []
else:
self.logger.warning(f"获取任务失败: {result_code} - {result_message}")
elif isinstance(data, list):
self.logger.info(f"成功获取到 {len(data)} 个任务")
return data
except requests.exceptions.RequestException as e:
self.logger.warning(f"从节点 {node_url} 获取任务失败: {str(e)}")
continue
except Exception as e:
self.logger.error(f"解析任务数据失败: {str(e)}\n{traceback.format_exc()}")
continue
self.logger.warning("无法从任何节点获取同步任务")
return []
except Exception as e:
self.logger.error(f"获取同步任务失败: {str(e)}\n{traceback.format_exc()}")
return []
def check_sync_task_status(self, tasks: List[Dict]) -> Dict:
"""检查同步任务状态"""
total = len(tasks)
success = 0
failed = 0
failed_tasks = []
tasks_detail = []
for task in tasks:
# 兼容不同的字段名
task_name = task.get('serviceName') or task.get('service_name') or task.get('taskId') or 'Unknown'
# Nacos-Sync 0.4.8 可能的状态值:SYNC, DELETE, STOP
task_status = task.get('taskStatus') or task.get('task_status') or task.get('status') or 'UNKNOWN'
source_cluster = task.get('sourceClusterId') or task.get('source_cluster_id') or 'unknown'
dest_cluster = task.get('destClusterId') or task.get('dest_cluster_id') or 'unknown'
version = task.get('version', '0')
# SYNC 表示正在同步(正常状态)
is_success = task_status in ['SYNC', 'RUNNING', 'SUCCESS']
if is_success:
success += 1
else:
failed += 1
failed_tasks.append({
'name': task_name,
'status': task_status,
'source_cluster': source_cluster,
'dest_cluster': dest_cluster,
'version': version
})
# 保存任务详情用于 metrics
tasks_detail.append({
'service_name': task_name,
'status': task_status,
'source_cluster': source_cluster,
'dest_cluster': dest_cluster,
'is_success': 1 if is_success else 0
})
self.metrics['sync_tasks_total'] = total
self.metrics['sync_tasks_success'] = success
self.metrics['sync_tasks_failed'] = failed
self.metrics['tasks_detail'] = tasks_detail
return {
'total': total,
'success': success,
'failed': failed,
'failed_tasks': failed_tasks
}
def check_service_instances(self, service_name: str) -> Dict:
"""检查 Nacos 和 Eureka 中的服务实例一致性"""
try:
# 从 Nacos 获取实例
nacos_instances = self.get_nacos_instances(service_name)
# 从 Eureka 获取实例
eureka_instances = self.get_eureka_instances(service_name)
nacos_count = len(nacos_instances)
eureka_count = len(eureka_instances)
diff = abs(nacos_count - eureka_count)
diff_ratio = diff / max(nacos_count, eureka_count, 1)
# 保存到 metrics
self.metrics['service_instances'][service_name] = {
'nacos_count': nacos_count,
'eureka_count': eureka_count,
'diff': diff,
'diff_ratio': diff_ratio
}
return {
'service': service_name,
'nacos_count': nacos_count,
'eureka_count': eureka_count,
'diff': diff,
'diff_ratio': diff_ratio,
'threshold_exceeded': diff_ratio > self.config['monitoring']['instance_count_check']['threshold']
}
except Exception as e:
self.logger.error(f"检查服务 {service_name} 实例一致性失败: {str(e)}")
return None
def get_nacos_token(self) -> Optional[str]:
"""获取 Nacos 访问 token"""
try:
# 检查缓存的 token 是否过期
if self.nacos_token and time.time() < self.nacos_token_expire:
return self.nacos_token
# 登录获取新 token
login_url = f"{self.config['nacos']['server_addr']}/nacos/v1/auth/login"
data = {
'username': self.config['nacos']['username'],
'password': self.config['nacos']['password']
}
response = requests.post(login_url, data=data, timeout=10)
if response.status_code == 200:
result = response.json()
self.nacos_token = result.get('accessToken')
# token 有效期通常是 18000 秒(5小时),这里设置为 4 小时后过期
self.nacos_token_expire = time.time() + 14400
self.logger.debug(f"成功获取 Nacos token")
return self.nacos_token
else:
self.logger.error(f"Nacos 登录失败: HTTP {response.status_code}")
return None
except Exception as e:
self.logger.error(f"获取 Nacos token 失败: {str(e)}")
return None
def get_nacos_instances(self, service_name: str) -> List[Dict]:
"""从 Nacos 获取服务实例"""
try:
# 获取访问 token
token = self.get_nacos_token()
url = f"{self.config['nacos']['server_addr']}/nacos/v1/ns/instance/list"
params = {
'serviceName': service_name,
'namespaceId': self.config['nacos']['namespace']
}
# 使用 token 认证
if token:
params['accessToken'] = token
self.logger.debug(f"获取 Nacos 服务实例: {service_name}, namespace: {self.config['nacos']['namespace']}")
response = requests.get(url, params=params, timeout=10)
if response.status_code == 200:
data = response.json()
hosts = data.get('hosts', [])
self.logger.debug(f"Nacos 返回 {len(hosts)} 个实例: {service_name}")
return hosts
elif response.status_code == 403:
self.logger.error(f"Nacos 访问被拒绝,可能是认证问题: {response.text}")
# 清除 token 缓存,下次重新获取
self.nacos_token = None
return []
else:
self.logger.warning(f"从 Nacos 获取服务实例失败: HTTP {response.status_code}, {response.text[:200]}")
return []
except Exception as e:
self.logger.error(f"从 Nacos 获取服务实例失败: {str(e)}")
return []
def get_eureka_instances(self, service_name: str) -> List[Dict]:
"""从 Eureka 获取服务实例"""
try:
url = f"{self.config['eureka']['server_addr']}/eureka/apps/{service_name.upper()}"
headers = {'Accept': 'application/json'}
response = requests.get(url, headers=headers, timeout=10)
if response.status_code == 200:
data = response.json()
application = data.get('application', {})
return application.get('instance', [])
return []
except Exception as e:
self.logger.error(f"从 Eureka 获取服务实例失败: {str(e)}")
return []
def send_dingtalk_alert(self, title: str, content: str, is_critical: bool = False):
"""发送钉钉告警"""
if not self.config['dingtalk']['enabled']:
return
try:
webhook = self.config['dingtalk']['webhook']
# 构建消息
message = {
"msgtype": "markdown",
"markdown": {
"title": title,
"text": f"### {title}\n\n{content}\n\n> {datetime.now().strftime('%Y-%m-%d %H:%M:%S')}"
},
"at": {
"atMobiles": self.config['dingtalk']['at_mobiles'],
"isAtAll": is_critical and self.config['dingtalk']['is_at_all']
}
}
# 如果配置了签名,添加签名
if self.config['dingtalk'].get('secret'):
import hmac
import hashlib
import base64
import urllib.parse
timestamp = str(round(time.time() * 1000))
secret = self.config['dingtalk']['secret']
secret_enc = secret.encode('utf-8')
string_to_sign = '{}\n{}'.format(timestamp, secret)
string_to_sign_enc = string_to_sign.encode('utf-8')
hmac_code = hmac.new(secret_enc, string_to_sign_enc, digestmod=hashlib.sha256).digest()
sign = urllib.parse.quote_plus(base64.b64encode(hmac_code))
webhook = f"{webhook}×tamp={timestamp}&sign={sign}"
response = requests.post(webhook, json=message, timeout=5)
if response.status_code == 200:
result = response.json()
if result.get('errcode') == 0:
self.logger.info(f"钉钉告警发送成功: {title}")
else:
self.logger.error(f"钉钉告警发送失败: {result.get('errmsg')}")
else:
self.logger.error(f"钉钉告警请求失败: {response.status_code}")
except Exception as e:
self.logger.error(f"发送钉钉告警失败: {str(e)}")
def generate_alert_content(self, check_results: Dict) -> Optional[tuple]:
"""生成告警内容"""
alerts = []
is_critical = False
# 检查节点状态
if check_results['nodes_status']:
down_nodes = [n for n in check_results['nodes_status'] if n['status'] == 'DOWN']
if down_nodes:
is_critical = True
alerts.append(f"**🔴 Nacos-Sync 节点异常**\n")
for node in down_nodes:
alerts.append(f"- 节点: {node['node']}")
if 'error' in node:
alerts.append(f" - 错误: {node['error']}")
# 检查同步任务
task_status = check_results.get('task_status', {})
if task_status.get('failed', 0) > 0:
is_critical = True
alerts.append(f"\n**🔴 同步任务失败**\n")
alerts.append(f"- 失败任务数: {task_status['failed']}/{task_status['total']}\n")
for task in task_status.get('failed_tasks', []):
alerts.append(f"- 服务: {task['name']}")
alerts.append(f" - 状态: {task['status']}")
alerts.append(f" - 源集群: {task['source_cluster']}")
alerts.append(f" - 目标集群: {task['dest_cluster']}")
# 检查实例差异
instance_checks = check_results.get('instance_checks', [])
threshold_exceeded = [c for c in instance_checks if c and c.get('threshold_exceeded')]
if threshold_exceeded:
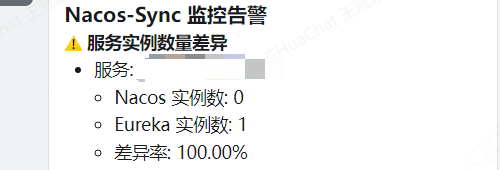
alerts.append(f"\n**⚠️ 服务实例数量差异**\n")
for check in threshold_exceeded:
alerts.append(f"- 服务: {check['service']}")
alerts.append(f" - Nacos 实例数: {check['nacos_count']}")
alerts.append(f" - Eureka 实例数: {check['eureka_count']}")
alerts.append(f" - 差异率: {check['diff_ratio']:.2%}")
if alerts:
return ("Nacos-Sync 监控告警", "\n".join(alerts), is_critical)
return None
def run_check(self) -> Dict:
"""执行一次完整检查"""
self.logger.info("开始执行监控检查...")
results = {}
# 1. 检查 nacos-sync 节点
results['nodes_status'] = self.check_nacos_sync_nodes()
self.logger.info(f"Nacos-Sync 节点状态: {self.metrics['nacos_sync_nodes_up']}/{self.metrics['nacos_sync_nodes_total']} UP")
# 2. 检查同步任务
tasks = self.get_sync_tasks()
results['task_status'] = self.check_sync_task_status(tasks)
self.logger.info(f"同步任务状态: {results['task_status']['success']}/{results['task_status']['total']} 成功")
# 3. 检查服务实例一致性(仅检查同步任务中的服务)
results['instance_checks'] = []
for task in tasks[:5]: # 限制检查数量,避免过多请求
service_name = task.get('serviceName')
if service_name:
check_result = self.check_service_instances(service_name)
if check_result:
results['instance_checks'].append(check_result)
# 4. 更新时间戳
self.metrics['last_check_timestamp'] = time.time()
# 5. 生成并发送告警
alert = self.generate_alert_content(results)
if alert:
title, content, is_critical = alert
self.send_dingtalk_alert(title, content, is_critical)
return results
def get_metrics(self) -> str:
"""生成 Prometheus metrics"""
metrics_lines = [
"# HELP nacos_sync_nodes_up Number of Nacos-Sync nodes up",
"# TYPE nacos_sync_nodes_up gauge",
f"nacos_sync_nodes_up {self.metrics['nacos_sync_nodes_up']}",
"",
"# HELP nacos_sync_nodes_total Total number of Nacos-Sync nodes",
"# TYPE nacos_sync_nodes_total gauge",
f"nacos_sync_nodes_total {self.metrics['nacos_sync_nodes_total']}",
"",
"# HELP nacos_sync_tasks_total Total number of sync tasks",
"# TYPE nacos_sync_tasks_total gauge",
f"nacos_sync_tasks_total {self.metrics['sync_tasks_total']}",
"",
"# HELP nacos_sync_tasks_success Number of successful sync tasks",
"# TYPE nacos_sync_tasks_success gauge",
f"nacos_sync_tasks_success {self.metrics['sync_tasks_success']}",
"",
"# HELP nacos_sync_tasks_failed Number of failed sync tasks",
"# TYPE nacos_sync_tasks_failed gauge",
f"nacos_sync_tasks_failed {self.metrics['sync_tasks_failed']}",
"",
"# HELP nacos_sync_last_check_timestamp Timestamp of last check",
"# TYPE nacos_sync_last_check_timestamp gauge",
f"nacos_sync_last_check_timestamp {self.metrics['last_check_timestamp']}",
"",
]
# 添加每个任务的详细状态
if self.metrics['tasks_detail']:
metrics_lines.extend([
"# HELP nacos_sync_task_status Status of individual sync task (1=success, 0=failed)",
"# TYPE nacos_sync_task_status gauge",
])
for task in self.metrics['tasks_detail']:
# 清理服务名称中的特殊字符
safe_service = task['service_name'].replace('-', '_').replace('.', '_')
safe_source = task['source_cluster'].replace('-', '_').replace('.', '_')
safe_dest = task['dest_cluster'].replace('-', '_').replace('.', '_')
safe_status = task['status'].replace('-', '_').replace('.', '_')
metrics_lines.append(
f'nacos_sync_task_status{{service="{task["service_name"]}",source="{task["source_cluster"]}",dest="{task["dest_cluster"]}",status="{task["status"]}"}} {task["is_success"]}'
)
metrics_lines.append("")
# 添加服务实例数量 metrics
if self.metrics['service_instances']:
metrics_lines.extend([
"# HELP nacos_service_instances Number of instances in Nacos",
"# TYPE nacos_service_instances gauge",
])
for service, data in self.metrics['service_instances'].items():
metrics_lines.append(
f'nacos_service_instances{{service="{service}"}} {data["nacos_count"]}'
)
metrics_lines.append("")
metrics_lines.extend([
"# HELP eureka_service_instances Number of instances in Eureka",
"# TYPE eureka_service_instances gauge",
])
for service, data in self.metrics['service_instances'].items():
metrics_lines.append(
f'eureka_service_instances{{service="{service}"}} {data["eureka_count"]}'
)
metrics_lines.append("")
metrics_lines.extend([
"# HELP service_instance_diff Difference between Nacos and Eureka instance count",
"# TYPE service_instance_diff gauge",
])
for service, data in self.metrics['service_instances'].items():
metrics_lines.append(
f'service_instance_diff{{service="{service}"}} {data["diff"]}'
)
metrics_lines.append("")
metrics_lines.extend([
"# HELP service_instance_diff_ratio Ratio of instance count difference",
"# TYPE service_instance_diff_ratio gauge",
])
for service, data in self.metrics['service_instances'].items():
metrics_lines.append(
f'service_instance_diff_ratio{{service="{service}"}} {data["diff_ratio"]:.4f}'
)
metrics_lines.append("")
return "\n".join(metrics_lines)
def main():
"""主函数"""
monitor = NacosSyncMonitor()
check_interval = monitor.config['nacos_sync']['check_interval']
monitor.logger.info(f"Nacos-Sync 监控启动,检查间隔: {check_interval}秒")
while True:
try:
monitor.run_check()
except Exception as e:
monitor.logger.error(f"监控检查异常: {str(e)}\n{traceback.format_exc()}")
time.sleep(check_interval)
if __name__ == "__main__":
main()
exporter.py
#!/usr/bin/env python3
# -*- coding: utf-8 -*-
"""
Prometheus Exporter for Nacos-Sync
提供 HTTP 服务暴露监控指标
"""

from flask import Flask, Response
import threading
import time
import logging
from monitor import NacosSyncMonitor

app = Flask(__name__)
monitor = None

@app.route('/metrics')
def metrics():
    """Prometheus metrics 端点"""
    return Response(monitor.get_metrics(), mimetype='text/plain')

@app.route('/health')
def health():
    """健康检查端点"""
    return {'status': 'UP', 'timestamp': time.time()}

def background_monitor():
    """后台监控线程"""
    check_interval = monitor.config['nacos_sync']['check_interval']

    while True:
        try:
            monitor.run_check()
        except Exception as e:
            logging.error(f"监控检查异常: {str(e)}")

        time.sleep(check_interval)

def main():
    """主函数"""
    global monitor

    # 初始化监控器
    monitor = NacosSyncMonitor()

    # 启动后台监控线程
    monitor_thread = threading.Thread(target=background_monitor, daemon=True)
    monitor_thread.start()

    # 启动 HTTP 服务
    port = monitor.config['prometheus']['port']
    logging.info(f"Prometheus Exporter 启动在端口 {port}")

    app.run(host='0.0.0.0', port=port)

if __name__ == "__main__":
    main()
启动exporter
nohup python3 exporter.py > nacos-sync-monitor.log 2>&1 &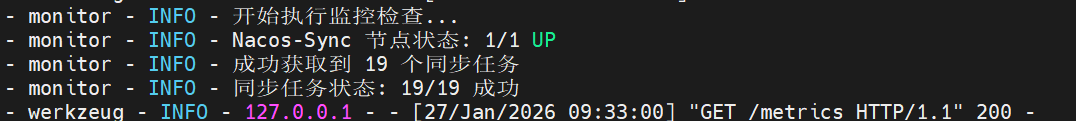
查看metrics
- 查看所有失败的同步任务
- nacos_sync_task_status{status!="SYNC"} == 0
- 查看特定服务的同步状态
- nacos_sync_task_status{service="test"}
- 查看实例数量不一致的服务
- service_instance_diff > 0
- 查看差异率超过10%的服务
- service_instance_diff_ratio > 0.1
- 按源集群分组统计任务数
- sum by (source) (nacos_sync_task_status)
- 按目标集群分组统计任务数
- sum by (dest) (nacos_sync_task_status)


添加prometheus job
  - job_name: 'nacos-sync-monitor'
    scrape_interval: 10s
    metrics_path: /metrics
    static_configs:
      - targets: ['1.2.3.4:9090']
        labels:
          group: 'nacos-sync-monitor'
添加grafana面板
{
"annotations": {
"list": [
{
"builtIn": 1,
"datasource": {
"type": "prometheus",
"uid": "Prometheus"
},
"enable": true,
"hide": true,
"iconColor": "rgba(0, 211, 255, 1)",
"name": "Annotations & Alerts",
"type": "dashboard"
}
]
},
"editable": true,
"gnetId": null,
"graphTooltip": 0,
"id": 66,
"links": [],
"panels": [
{
"datasource": null,
"fieldConfig": {
"defaults": {
"color": {
"mode": "thresholds"
},
"mappings": [],
"thresholds": {
"mode": "absolute",
"steps": [
{
"color": "red",
"value": null
},
{
"color": "yellow",
"value": 1
},
{
"color": "green",
"value": 3
}
]
},
"unit": "short"
},
"overrides": []
},
"gridPos": {
"h": 8,
"w": 6,
"x": 0,
"y": 0
},
"id": 1,
"options": {
"colorMode": "value",
"graphMode": "area",
"justifyMode": "auto",
"orientation": "auto",
"reduceOptions": {
"calcs": [
"lastNotNull"
],
"fields": "",
"values": false
},
"text": {},
"textMode": "auto"
},
"pluginVersion": "7.5.11",
"targets": [
{
"expr": "nacos_sync_nodes_up",
"refId": "A"
}
],
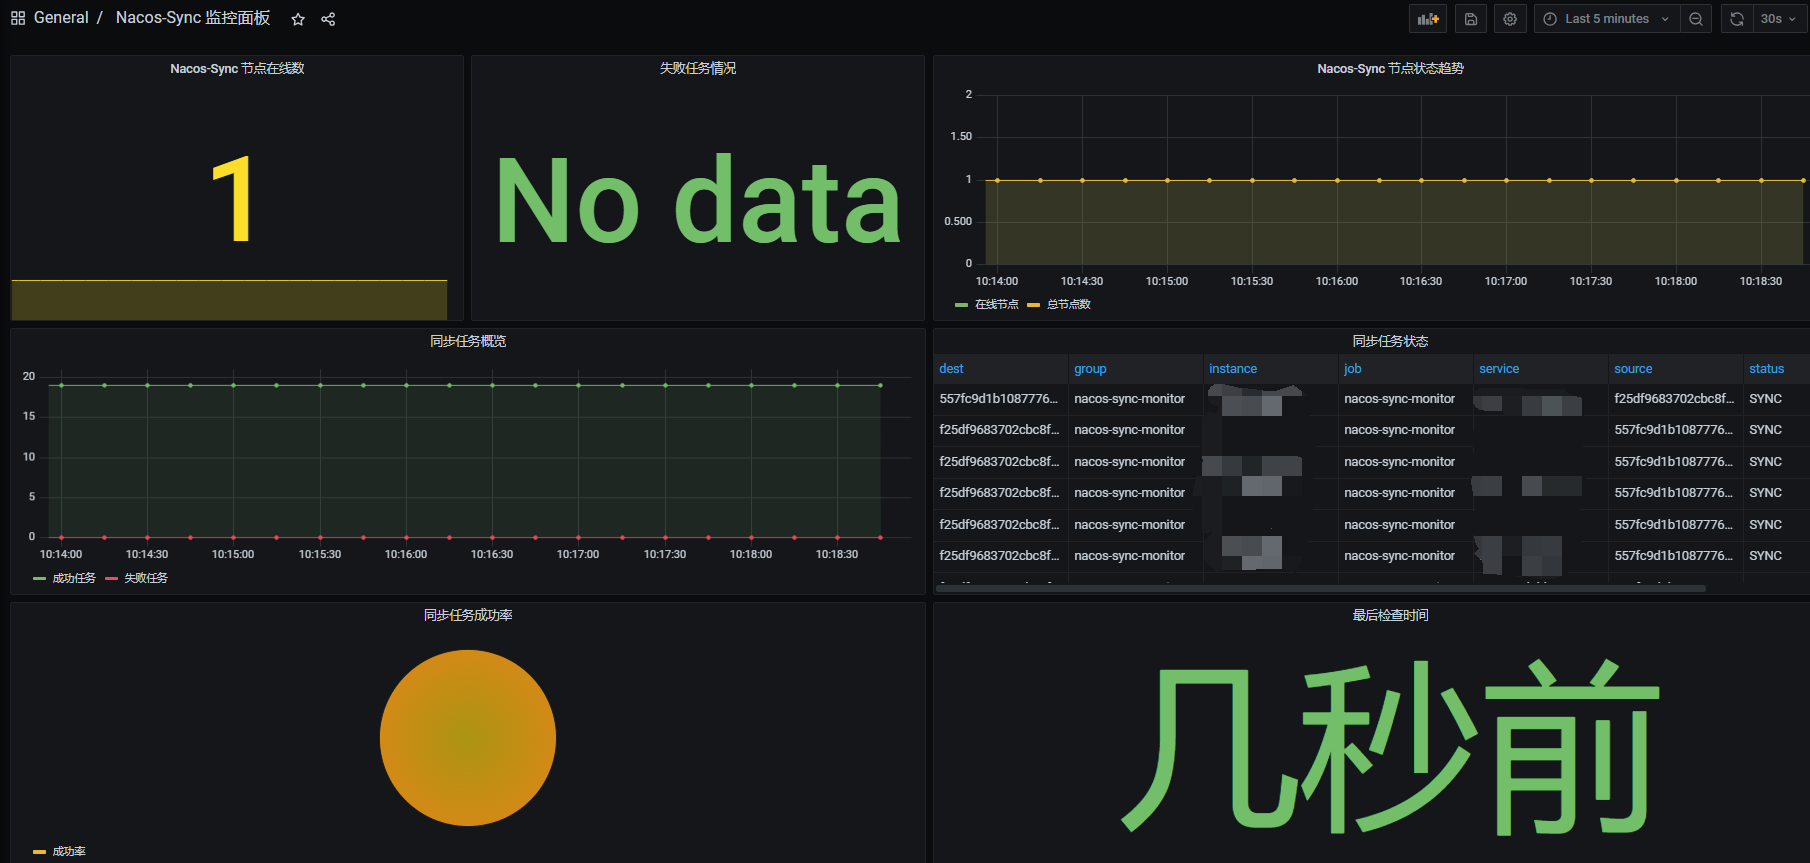
"title": "Nacos-Sync 节点在线数",
"type": "stat"
},
{
"datasource": null,
"fieldConfig": {
"defaults": {
"color": {
"mode": "thresholds"
},
"mappings": [],
"thresholds": {
"mode": "absolute",
"steps": [
{
"color": "green",
"value": null
},
{
"color": "red",
"value": 1
}
]
},
"unit": "short"
},
"overrides": []
},
"gridPos": {
"h": 8,
"w": 6,
"x": 6,
"y": 0
},
"id": 2,
"options": {
"colorMode": "value",
"graphMode": "area",
"justifyMode": "auto",
"orientation": "auto",
"reduceOptions": {
"calcs": [
"lastNotNull"
],
"fields": "",
"values": false
},
"text": {},
"textMode": "auto"
},
"pluginVersion": "7.5.11",
"targets": [
{
"exemplar": true,
"expr": "nacos_sync_task_status{status!=\"SYNC\"} == 0",
"interval": "",
"legendFormat": "",
"refId": "A"
}
],
"title": "失败任务情况",
"type": "stat"
},
{
"datasource": null,
"fieldConfig": {
"defaults": {
"color": {
"mode": "palette-classic"
},
"custom": {
"axisLabel": "",
"axisPlacement": "auto",
"barAlignment": 0,
"drawStyle": "line",
"fillOpacity": 10,
"gradientMode": "none",
"hideFrom": {
"graph": false,
"legend": false,
"tooltip": false,
"viz": false
},
"lineInterpolation": "linear",
"lineWidth": 1,
"pointSize": 5,
"scaleDistribution": {
"type": "linear"
},
"showPoints": "auto",
"spanNulls": false
},
"mappings": [],
"thresholds": {
"mode": "absolute",
"steps": [
{
"color": "green",
"value": null
}
]
},
"unit": "short"
},
"overrides": []
},
"gridPos": {
"h": 8,
"w": 12,
"x": 12,
"y": 0
},
"id": 3,
"options": {
"legend": {
"calcs": [],
"displayMode": "list",
"placement": "bottom",
"showLegend": true
},
"tooltip": {
"mode": "single",
"sort": "none"
},
"tooltipOptions": {
"mode": "single"
}
},
"targets": [
{
"expr": "nacos_sync_nodes_up",
"legendFormat": "在线节点",
"refId": "A"
},
{
"expr": "nacos_sync_nodes_total",
"legendFormat": "总节点数",
"refId": "B"
}
],
"title": "Nacos-Sync 节点状态趋势",
"type": "timeseries"
},
{
"datasource": null,
"fieldConfig": {
"defaults": {
"color": {
"mode": "palette-classic"
},
"custom": {
"axisLabel": "",
"axisPlacement": "auto",
"barAlignment": 0,
"drawStyle": "line",
"fillOpacity": 10,
"gradientMode": "none",
"hideFrom": {
"graph": false,
"legend": false,
"tooltip": false,
"viz": false
},
"lineInterpolation": "linear",
"lineWidth": 1,
"pointSize": 5,
"scaleDistribution": {
"type": "linear"
},
"showPoints": "auto",
"spanNulls": false
},
"mappings": [],
"thresholds": {
"mode": "absolute",
"steps": [
{
"color": "green",
"value": null
}
]
},
"unit": "short"
},
"overrides": [
{
"matcher": {
"id": "byName",
"options": "失败任务"
},
"properties": [
{
"id": "color",
"value": {
"fixedColor": "red",
"mode": "fixed"
}
}
]
},
{
"matcher": {
"id": "byName",
"options": "成功任务"
},
"properties": [
{
"id": "color",
"value": {
"fixedColor": "green",
"mode": "fixed"
}
}
]
}
]
},
"gridPos": {
"h": 8,
"w": 12,
"x": 0,
"y": 8
},
"id": 4,
"options": {
"legend": {
"calcs": [],
"displayMode": "list",
"placement": "bottom",
"showLegend": true
},
"tooltip": {
"mode": "single",
"sort": "none"
},
"tooltipOptions": {
"mode": "single"
}
},
"targets": [
{
"expr": "nacos_sync_tasks_success",
"legendFormat": "成功任务",
"refId": "A"
},
{
"expr": "nacos_sync_tasks_failed",
"legendFormat": "失败任务",
"refId": "B"
}
],
"title": "同步任务概览",
"type": "timeseries"
},
{
"datasource": null,
"fieldConfig": {
"defaults": {
"color": {
"mode": "thresholds"
},
"custom": {
"align": "auto",
"filterable": false
},
"mappings": [],
"thresholds": {
"mode": "absolute",
"steps": [
{
"color": "green",
"value": null
},
{
"color": "red",
"value": 80
}
]
}
},
"overrides": []
},
"gridPos": {
"h": 8,
"w": 12,
"x": 12,
"y": 8
},
"id": 5,
"options": {
"showHeader": true
},
"pluginVersion": "7.5.11",
"targets": [
{
"exemplar": true,
"expr": "nacos_sync_task_status",
"format": "table",
"instant": true,
"interval": "",
"legendFormat": "",
"refId": "A"
}
],
"title": "同步任务状态",
"transformations": [
{
"id": "organize",
"options": {
"excludeByName": {
"Time": true,
"__name__": true
},
"indexByName": {},
"renameByName": {
"Value": "任务总数"
}
}
}
],
"type": "table"
},
{
"datasource": null,
"fieldConfig": {
"defaults": {
"color": {
"mode": "palette-classic"
},
"mappings": [],
"thresholds": {
"mode": "absolute",
"steps": [
{
"color": "green",
"value": null
},
{
"color": "red",
"value": 80
}
]
},
"unit": "percentunit"
},
"overrides": []
},
"gridPos": {
"h": 8,
"w": 12,
"x": 0,
"y": 16
},
"id": 6,
"options": {
"displayLabels": [],
"legend": {
"displayMode": "list",
"placement": "bottom",
"showLegend": true,
"values": []
},
"pieType": "pie",
"reduceOptions": {
"calcs": [
"lastNotNull"
],
"fields": "",
"values": false
},
"text": {},
"tooltip": {
"mode": "single",
"sort": "none"
}
},
"targets": [
{
"expr": "nacos_sync_tasks_success / nacos_sync_tasks_total",
"legendFormat": "成功率",
"refId": "A"
}
],
"title": "同步任务成功率",
"type": "piechart"
},
{
"datasource": null,
"fieldConfig": {
"defaults": {
"color": {
"mode": "thresholds"
},
"mappings": [],
"thresholds": {
"mode": "absolute",
"steps": [
{
"color": "green",
"value": null
}
]
},
"unit": "dateTimeFromNow"
},
"overrides": []
},
"gridPos": {
"h": 8,
"w": 12,
"x": 12,
"y": 16
},
"id": 7,
"options": {
"colorMode": "value",
"graphMode": "none",
"justifyMode": "auto",
"orientation": "auto",
"reduceOptions": {
"calcs": [
"lastNotNull"
],
"fields": "",
"values": false
},
"text": {},
"textMode": "auto"
},
"pluginVersion": "7.5.11",
"targets": [
{
"expr": "nacos_sync_last_check_timestamp * 1000",
"refId": "A"
}
],
"title": "最后检查时间",
"type": "stat"
}
],
"refresh": "30s",
"schemaVersion": 27,
"style": "dark",
"tags": [
"nacos-sync",
"monitoring"
],
"templating": {
"list": []
},
"time": {
"from": "now-5m",
"to": "now"
},
"timepicker": {},
"timezone": "",
"title": "Nacos-Sync 监控面板",
"uid": "nacos-sync-monitor",
"version": 6
}
查看告警
当异常时,钉钉可以收到消息: