介绍
插件官网地址:https://grafana.com/grafana/plugins/devopsprodigy-kubegraf-app/
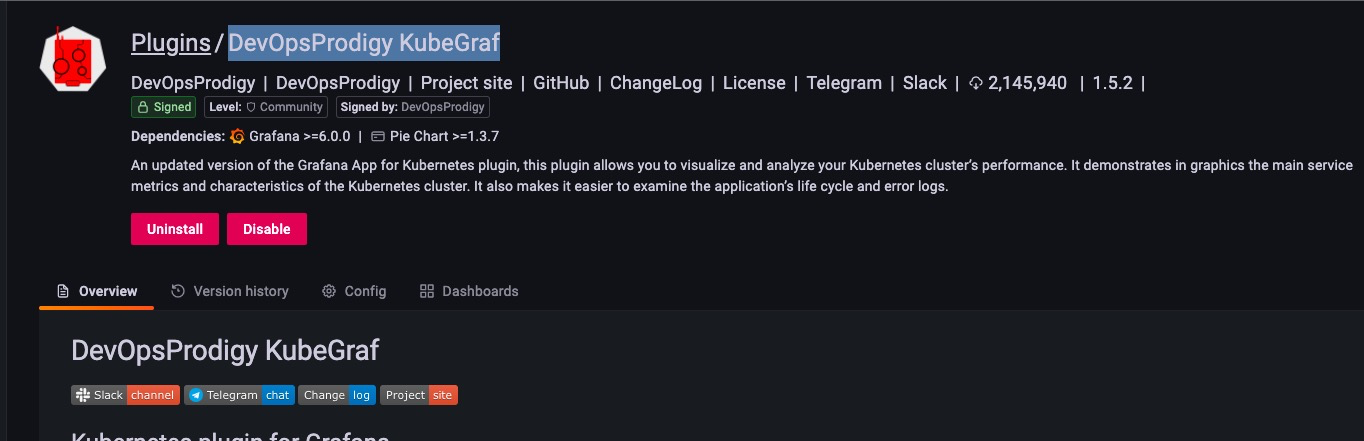
DevOpsProdigy KubeGraf是一个非常优秀的 Grafana Kubernetes 插件,是 Grafana 官方的 Kubernetes 插件(https://grafana.com/plugins/grafana-kubernetes-app) 的升级版本,该插件可以用来可视化和分析 Kubernetes 集群的性能,通过各种图形直观的展示了 Kubernetes 集群的主要服务的指标和特征,还可以用于检查应用程序的生命周期和错误日志。
依赖
- Grafana > 5.0.0 版本
-需要在 Kubernetes 集群上部署 Prometheus + node-exporter + kube-state-metrics - 依赖 Grafana-piechart-panel 插件
安装
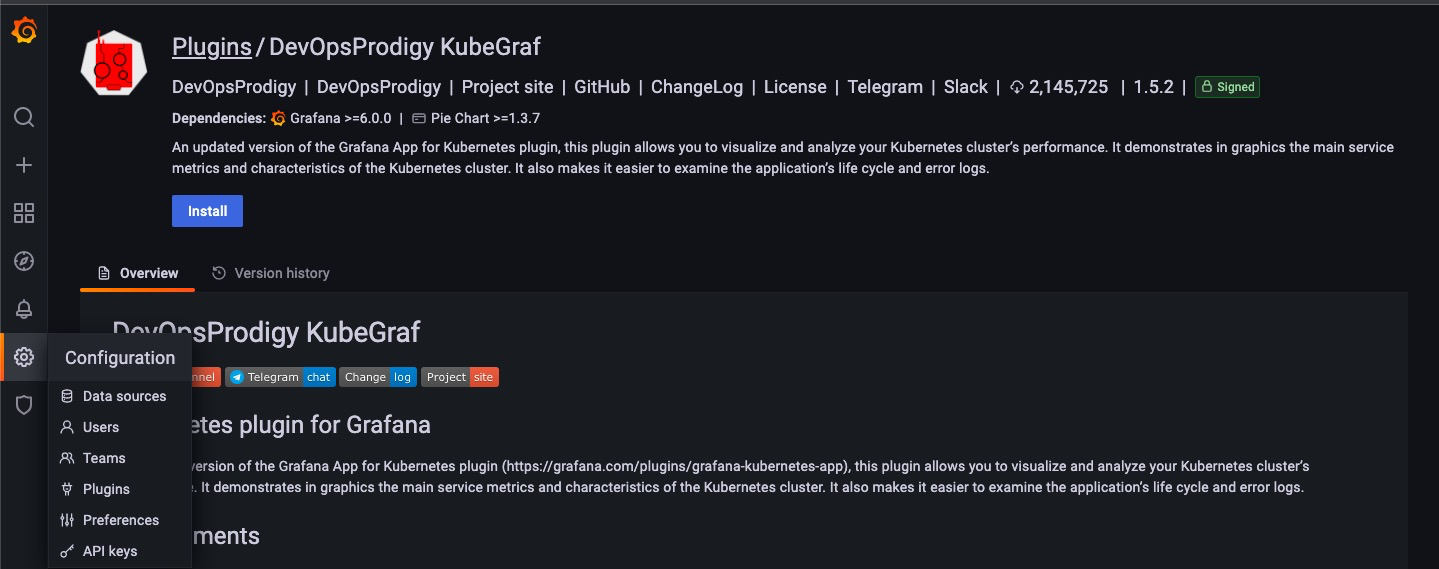
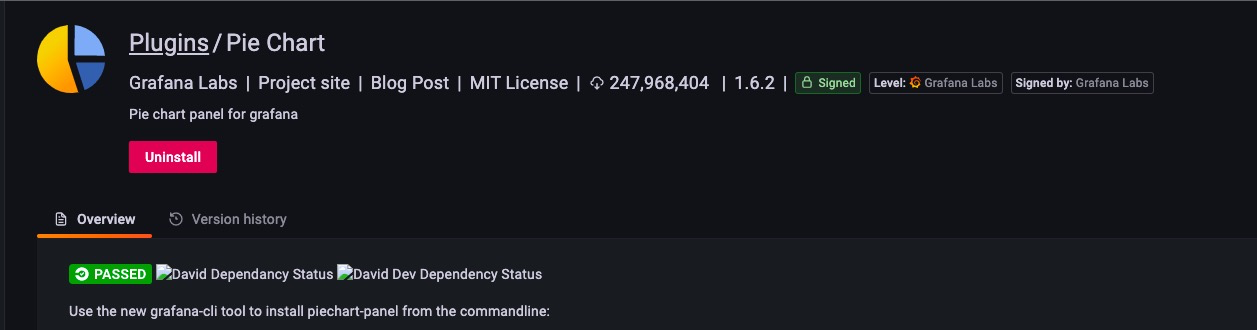
grafana插件中可以搜到这个插件,但是直接安装的话是失败的,因为需要依赖grafana-piechart-panel插件。
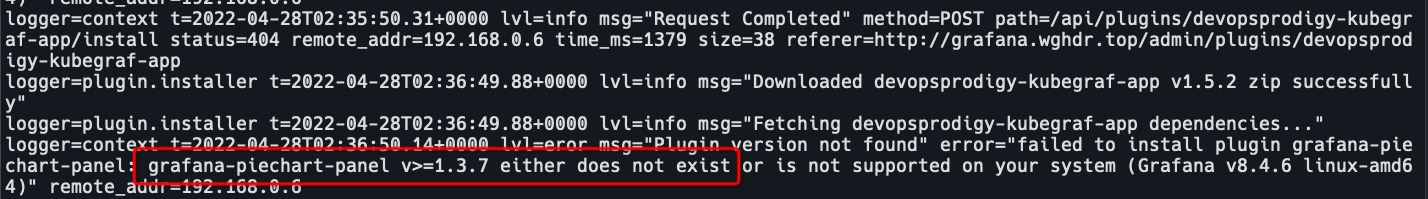
- 进入容器,安装grafana-piechart-panel插件
grafana-cli plugins install Grafana-piechart-panel报错目录不是可写的

尝试修改权限,报错没有这个目录
修改插件安装目录,报错没有tmp下的压缩包grafana-cli --pluginsDir /opt/bitnami/grafana/data/plugins/ plugins install Grafana-piechart-panel - 查看并修改deployment
注意:我的grafana是helm安装的bitnami/grafana,如果不是这么安装的,以上报错可能不会有,也就不用修改deployment!k edit deploy grafana -n thanos # 添加tmp目录挂载 volumeMounts: - mountPath: /tmp name: tmp volumes: - emptyDir: {} name: tmp - 等待pod ready,返回grafana插件页面,搜索Pie Chart点击安装
搜索DevOpsProdigy KubeGraf,点击enable
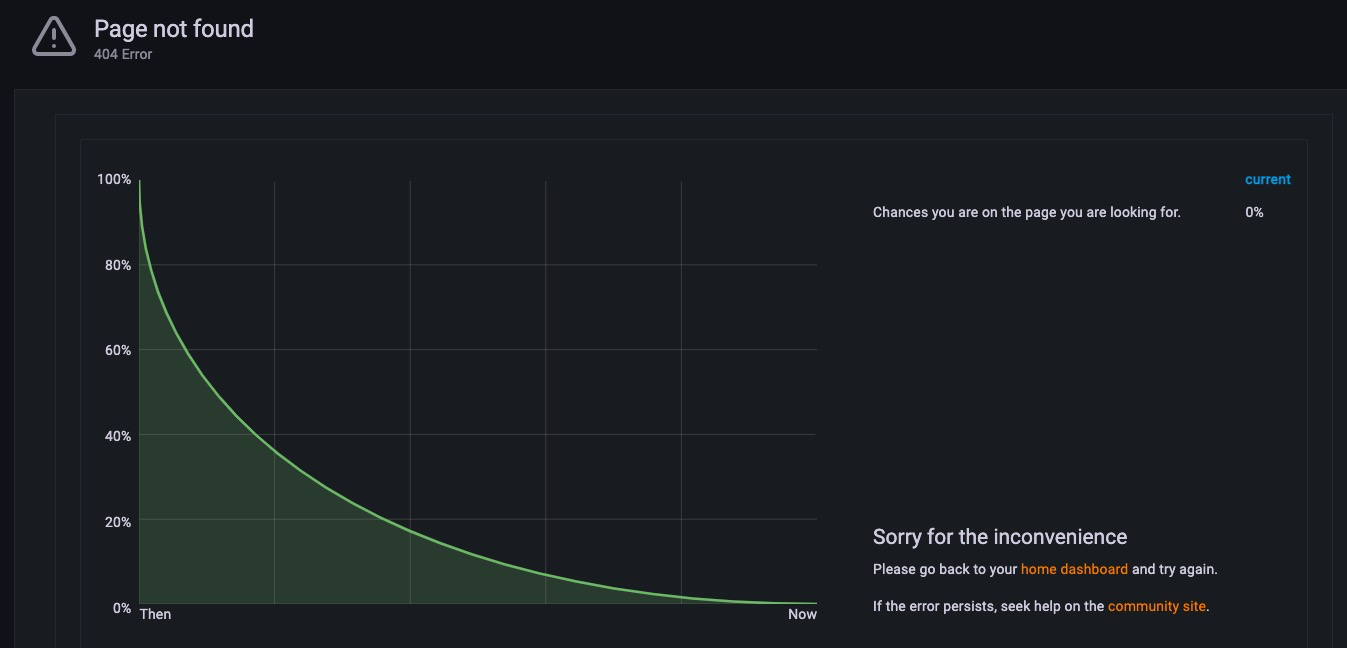
- 点击config下的Setup your first k8s-cluster,创建一个新的 Kubernetes 集群
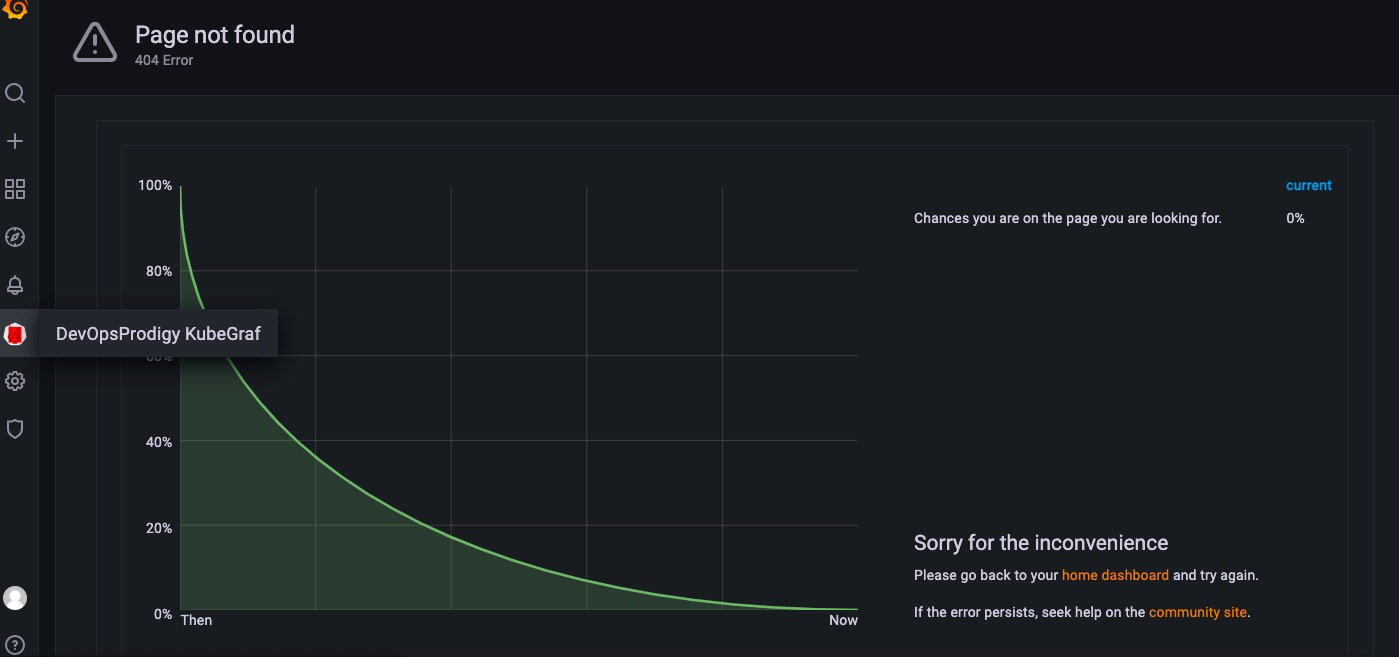
这里会返回404,因为还没有对集群的访问权限。
grafana的日志是告警没有数据。
- 添加ns,授权用户
kubectl create ns kubegraf kubectl apply -f https://raw.githubusercontent.com/devopsprodigy/kubegraf/master/kubernetes/serviceaccount.yaml kubectl apply -f https://raw.githubusercontent.com/devopsprodigy/kubegraf/master/kubernetes/clusterrole.yaml # 如果报错:error: unable to recognize "clusterrole.yaml": no matches for kind "ClusterRole" in version "rbac.authorization.k8s.io/v1beta1" # 需要把rbac.authorization.k8s.io/v1beta1改成rbac.authorization.k8s.io/v1 kubectl apply -f https://raw.githubusercontent.com/devopsprodigy/kubegraf/master/kubernetes/clusterrolebinding.yaml kubectl apply -f https://raw.githubusercontent.com/devopsprodigy/kubegraf/master/kubernetes/secret.yaml - 创建grafana-kubegraf证书
openssl genrsa -out grafana-kubegraf.key 2048
openssl req -new -key grafana-kubegraf.key -out grafana-kubegraf.csr -subj "/CN=grafana-kubegraf/O=thanos"
openssl x509 -req -in grafana-kubegraf.csr -CA /etc/kubernetes/pki/ca.crt -CAkey /etc/kubernetes/pki/ca.key -out /etc/kubernetes/pki/grafana-kubegraf.crt -CAcreateserial
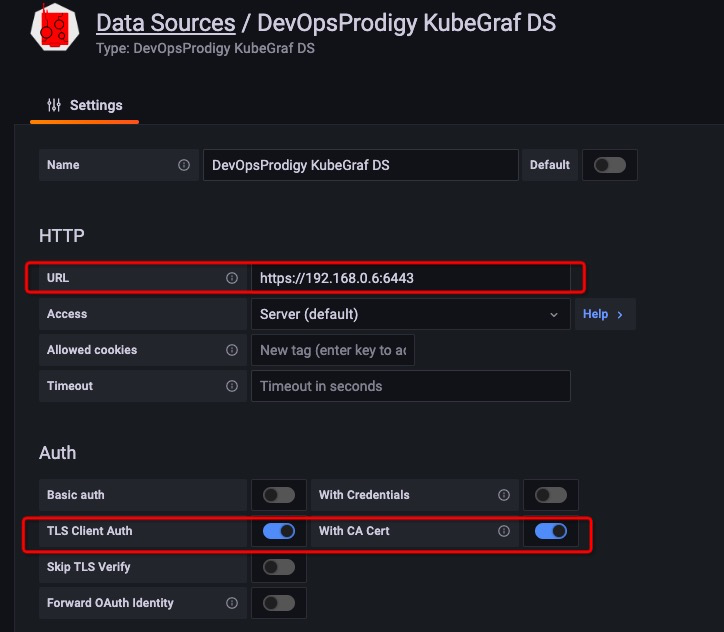
复制证书到其他master上,或者查看tokenkubectl get secret grafana-kubegraf-token-cm96s -o jsonpath={.data.token} -n kubegraf | base64 -d - 配置DevOpsProdigy KubeGraf DS数据源
URL:集群apiserver的地址,可以通过kubectl cluster-info获取。
Auth:勾选 TLSClientAuth 和 WithCACert。
查看集群的kubeconfig文件,将token进行base64 -d解码
CA Cert:certificate-authority-data
Client Cert:client-certificate-data
Client Key:client-key-data
additional datasources:选择prometheus
点击save and test,测试成功。
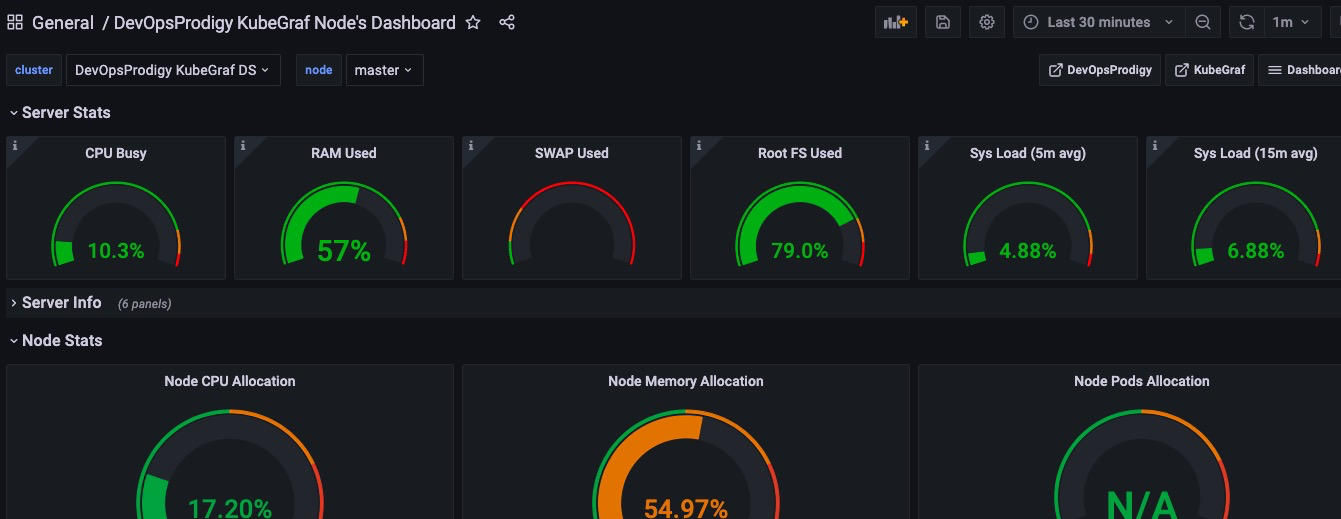
- 查看集群状态
页面返回了404,搜了下,是因为这个插件已经不支持grafana8.0以上的版本了。
https://github.com/devopsprodigy/kubegraf/issues/61 - 查看dashboard