背景
我有多个环境的prometheus,每个环境都在不同地区,都在内网且无法互通。我想通过一个平台来实现查询多个环境的监控信息。有什么工具可以实现这个功能呢?答案是thanos,当然如果用一个prometheus联邦来实现也可以,但是这种用于汇总的prometheus需要很多的资源,不合适。
thanos有两种架构,一种是sidecar模式,一种是receive模式。它们都可以将数据上传到OSS以供长期保存,区别在于最新数据的存储。参考这里:
-
由于数据上传不可能实时,Sidecar 模式将最新的监控数据存到 Prometheus 本地,Query 通过调所有 Sidecar 的 Store API 来获取最新数据,这就成一个问题:如果 Sidecar 数量非常多或者 Sidecar 跟 Query 离的比较远,每次查询 Query 都调所有 Sidecar 会消耗很多资源,并且速度很慢,而我们查看监控大多数情况都是看的最新数据。
-
而 Receiver 就是为了解决这个问题,它适配了 Prometheus 的 remote write API,也就是所有 Prometheus 实例可以实时将数据 push 到 Thanos Receiver,最新数据也得以集中起来,然后 Thanos Query 也不用去所有 Sidecar 查最新数据了,直接查 Thanos Receiver 即可。另外,Thanos Receiver 也将数据上传到OSS以供长期保存,当然,OSS中的数据同样由 Thanos Store Gateway 暴露给 Thanos Query。
综上thanos-receive模式最适合我的环境。
架构图

部署
这里介绍过thanos-sidecar模式部署。下面介绍下receive模式。
下载thanos
helm repo add bitnami https://charts.bitnami.com/bitnami
helm pull bitnami/thanos
tar xvf thanos-12.14.1.tgz
cd thanos
修改values.yaml
根据你自己的环境对应修改。对象存储配置参考官方文档:https://thanos.io/tip/thanos/storage.md/
k get sc

global:
    storageClass: "fast"
objstoreConfig: |-
  type: S3
  config:
  # 我这里用的minio,即minion地址。
    endpoint: "1.2.3.4:12345"
    bucket: "thanos"
    access_key: "minio"
    secret_key: "minio123"
    # 开启非安全访问否则会连接报错。
    insecure: true

query:
    enabled: true
    dnsDiscovery:
    # 必须开启dnsDiscovery,否则会找不到thanos存储等后端服务
        enabled: true
queryFrontend:
    service:
        type: NodePort
bucketweb:
    enabled: true
    service:
        type: NodePort
compactor:
    enabled: true
    persistence:
        enabled: true
storegateway:
    enabled: true
    persistence:
        enabled: true
ruler:
    enabled: true
    alertmanagers:
    - http://prometheus-kube-prometheus-alertmanager.thanos.svc.cluster.local:9093
    # 你的alertmanager FQDN地址+端口
    config: |-
    groups:
      - name: "metamonitoring"
        rules:
          - alert: "PrometheusDown"
            expr: absent(up{prometheus="thanos/prometheus-kube-prometheus-prometheus"})
    persistence:
        enabled: true
receive:
    # 使用receive模式。
    enabled: true
安装
helm install thanos --create-namespace . -n thanos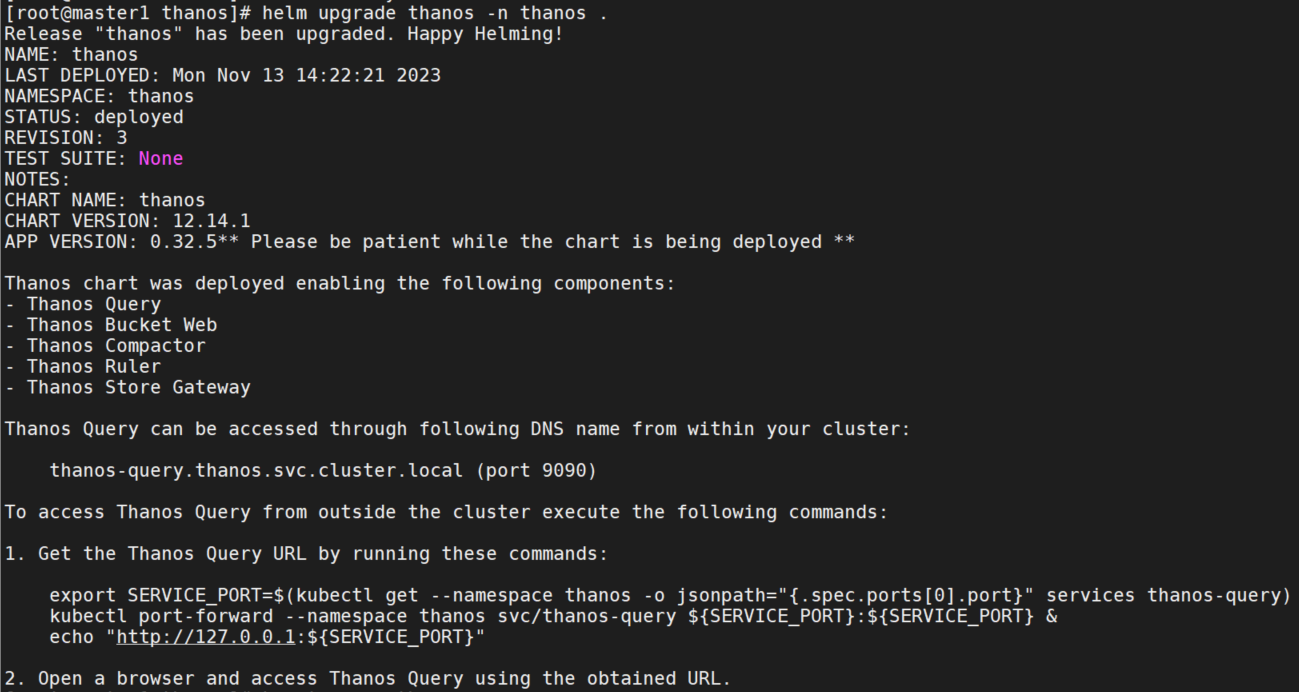
查看服务

prometheus部署
如果环境中已经部署了prometheus,需要开启remote_write重新部署。如果没有部署可以参考thanos部署。
查看thanos-receive端口,可以看到remote-write端口为19291。
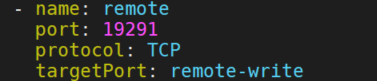
地址为thanos-receive地址。
remoteRead:
  - url: "http://thanos-receive.thanos.svc.cluster.local:19291/api/v1/read"
remoteWrite:
  - url: "http://thanos-receive.thanos.svc.cluster.local:19291/api/v1/receive"
enableRemoteWriteReceiver: true具体配置项参考:https://thanos.io/tip/components/receive.md/#receiver
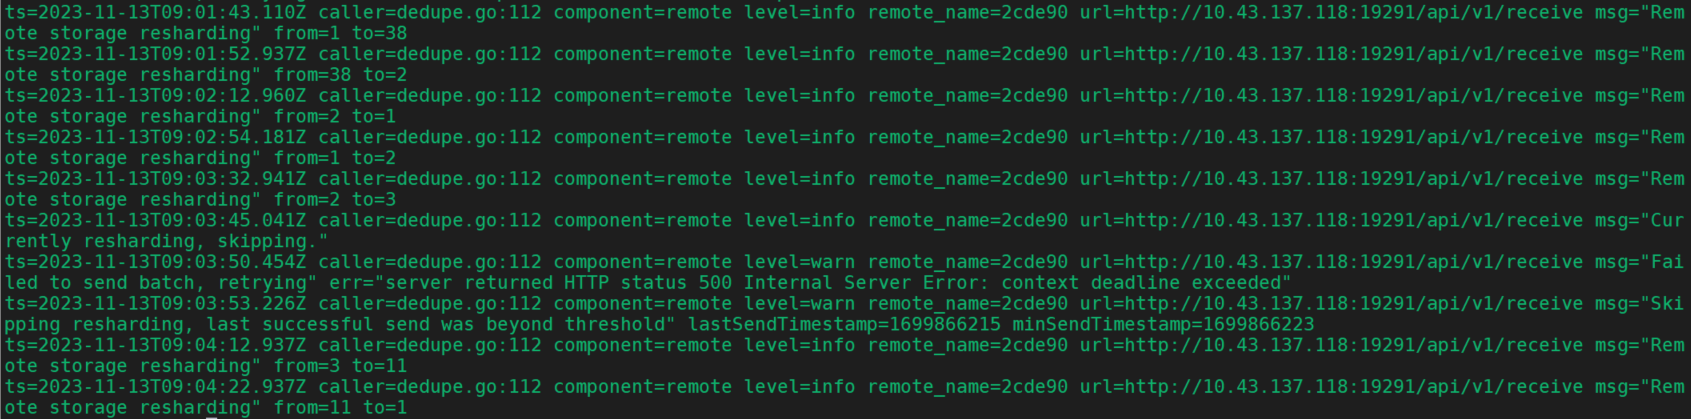
开启后查看prometheus日志,可以看到Done replaying WAL输出,证明metrics信息已经发送到了remove_write即thanos-receive。

查看分片信息:
页面查询
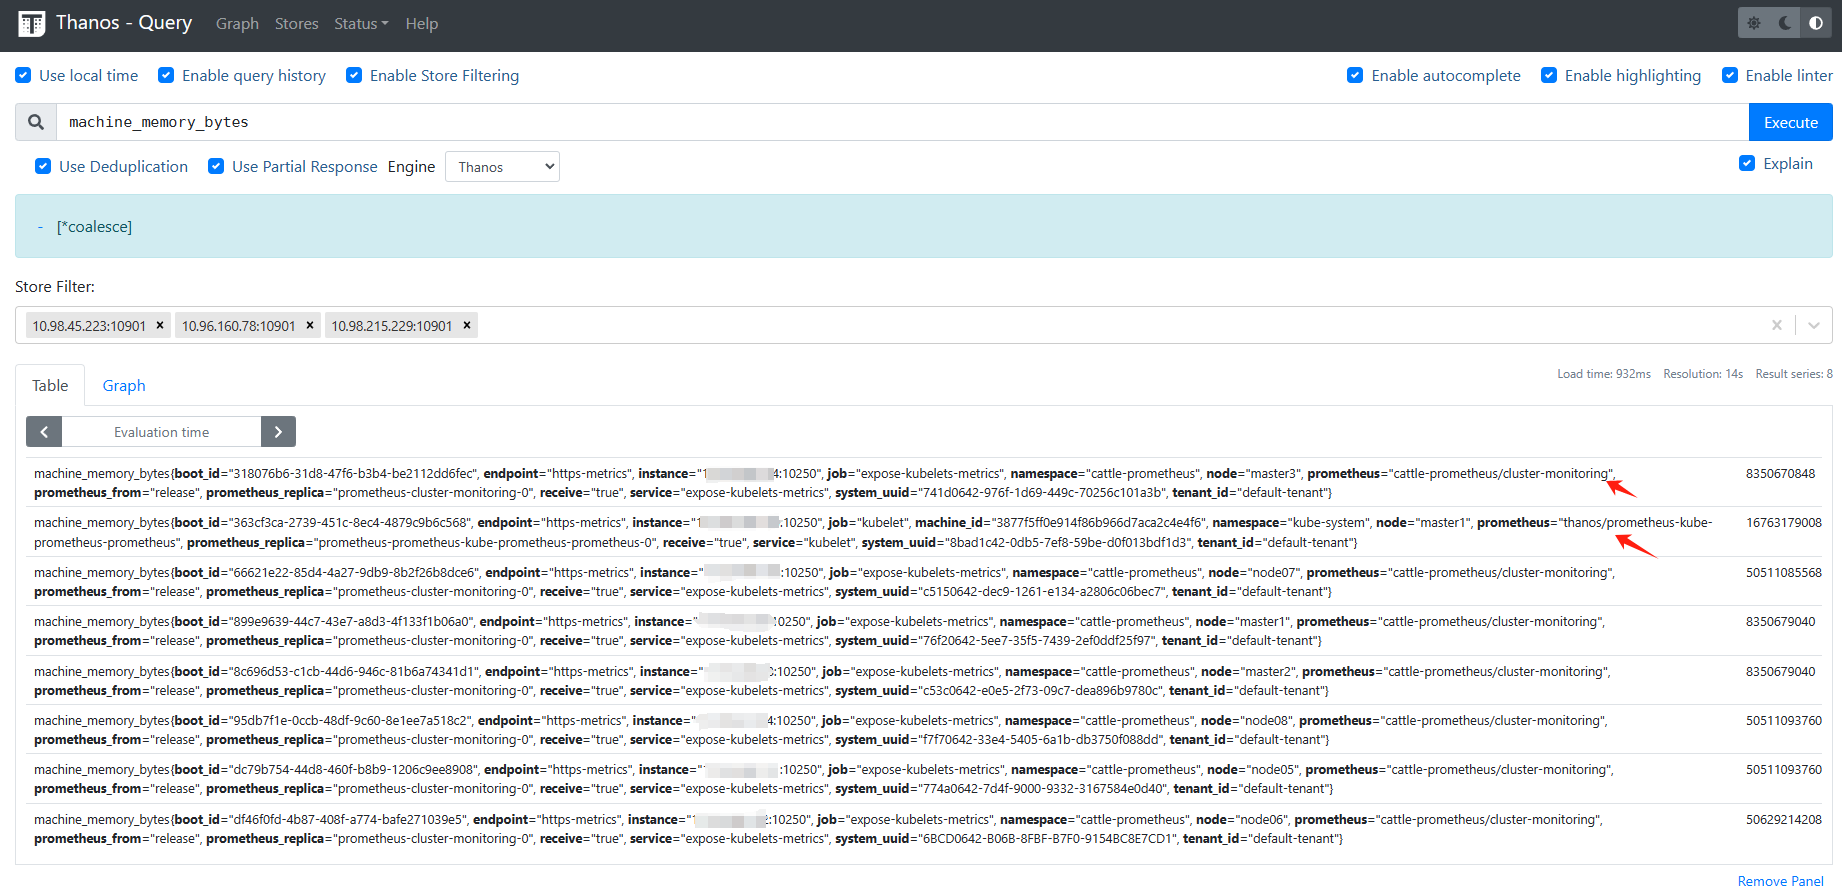
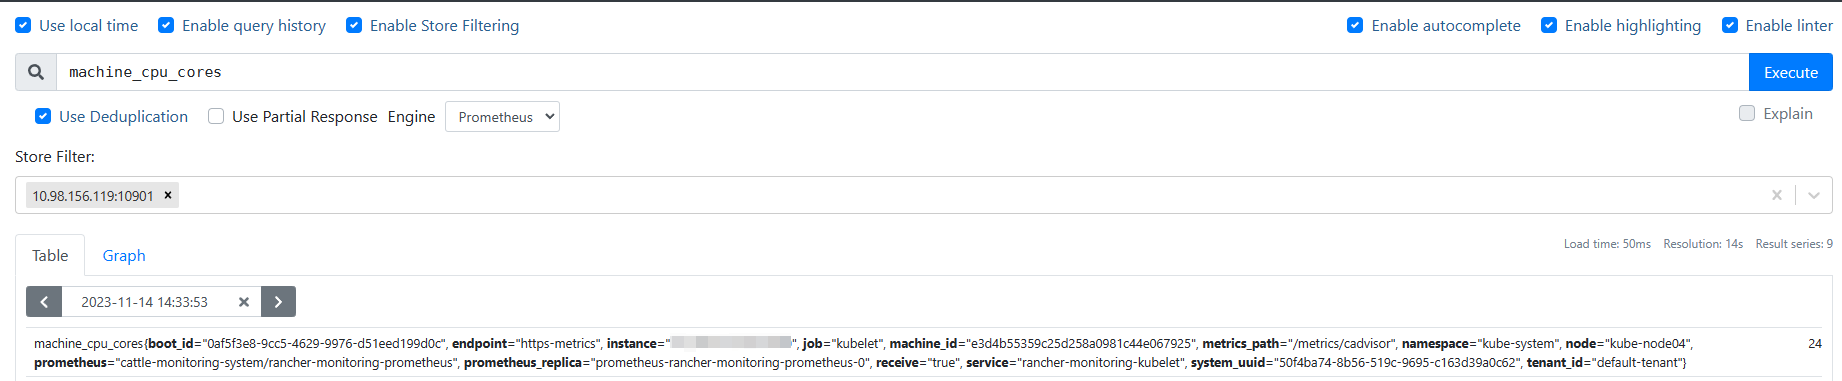
thanos-query
查询metrics,我这里是2个不同环境的prometheus,在下图中可以同时看到不同环境中的metrics信息。
查询历史数据
开启Enable Store Filtering选项,可以看到下方可以选择地址,即thanos-receive,thanos-ruler,thanos-storegateway的地址。
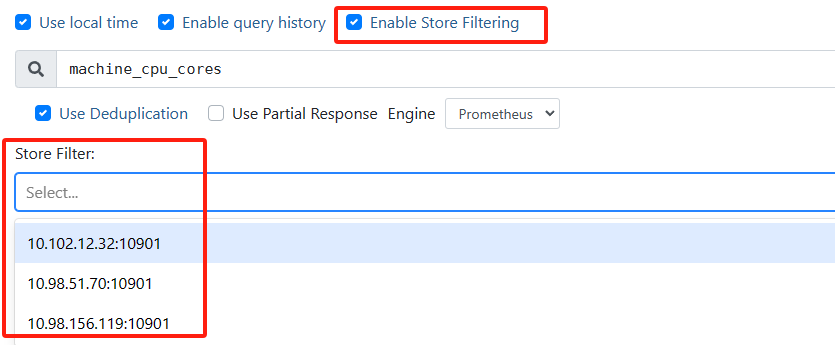

选择thanos-receive的地址可以看实时数据也可以看历史数据。

选择thanos-storegateway的地址可以看保存在minio中的历史数据。不能看实时数据的原因是thanos-receive中的数据还没有上传到minio中。
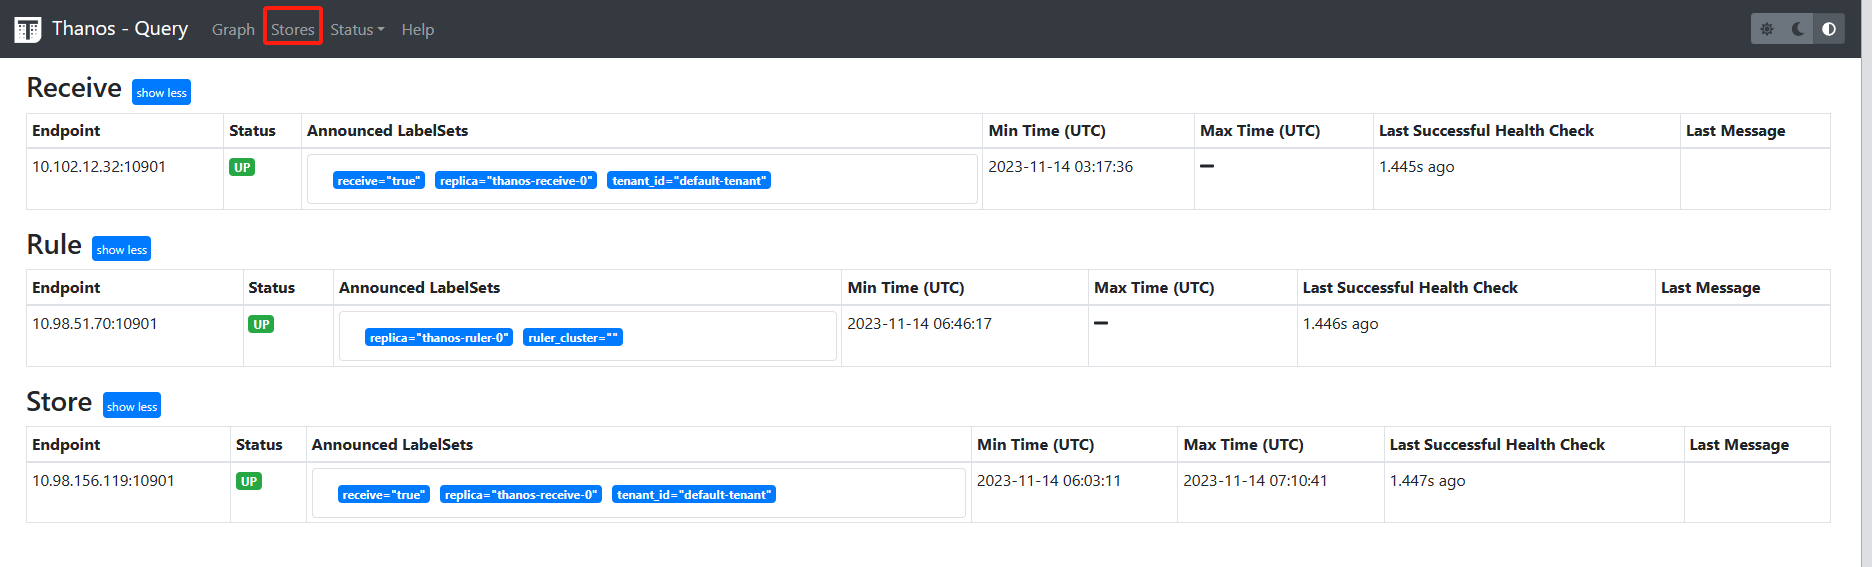
查看存储后端
点击Stores,即上面说的三个thanos服务地址。
查看告警
可以在thanos-query页面点击Status-alerts:
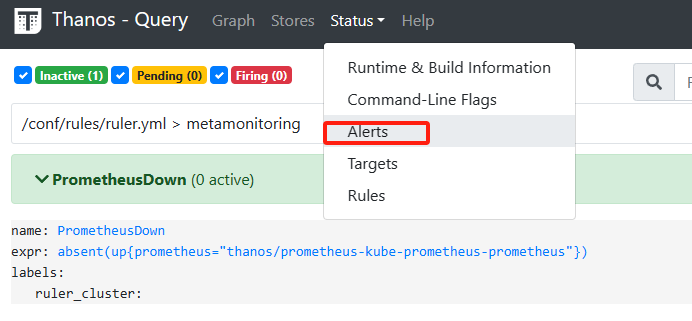
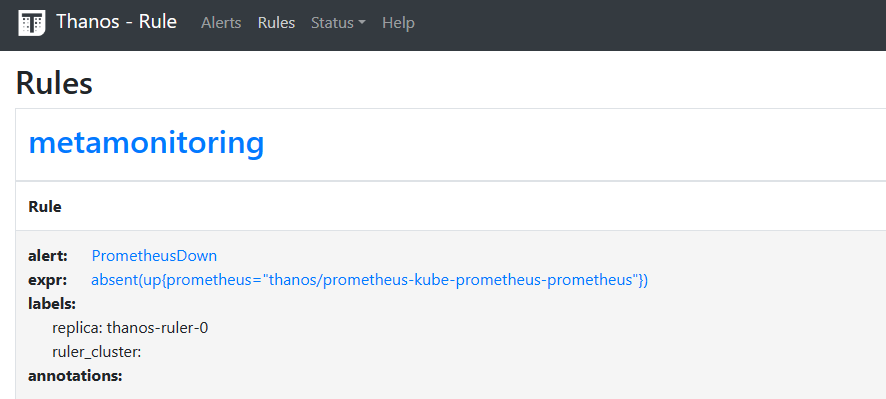
也可以在thanos-rule页面上查看:
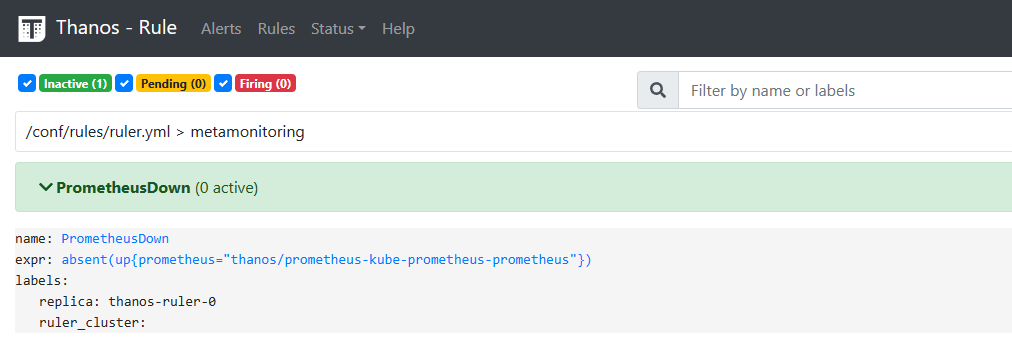
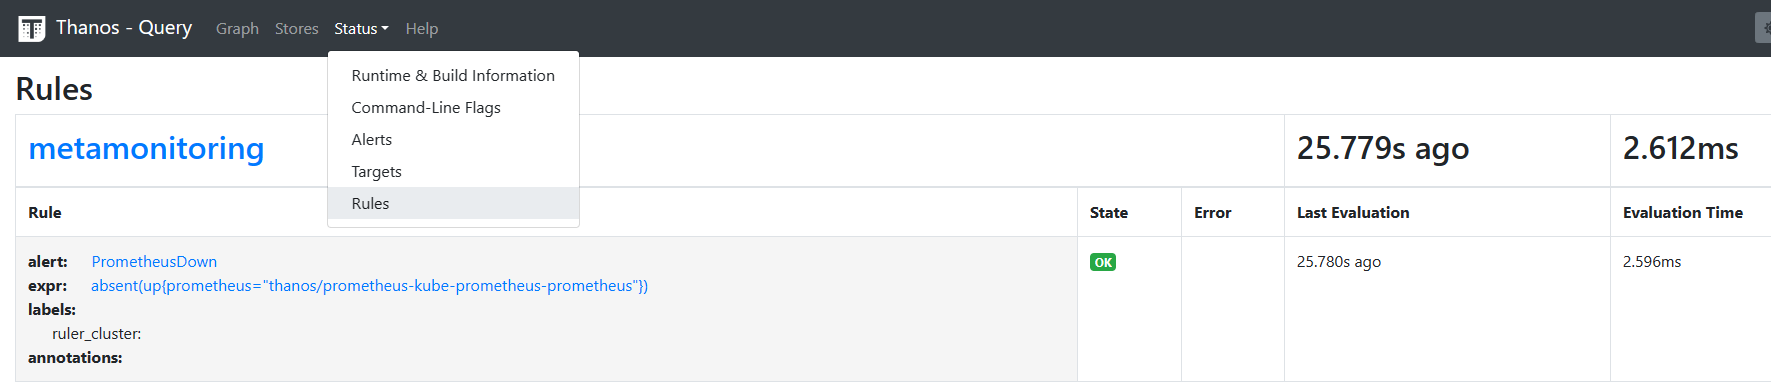
查看告警规则
同理,可以在thanos-query页面,也可以在thanos-rule页面上查看。
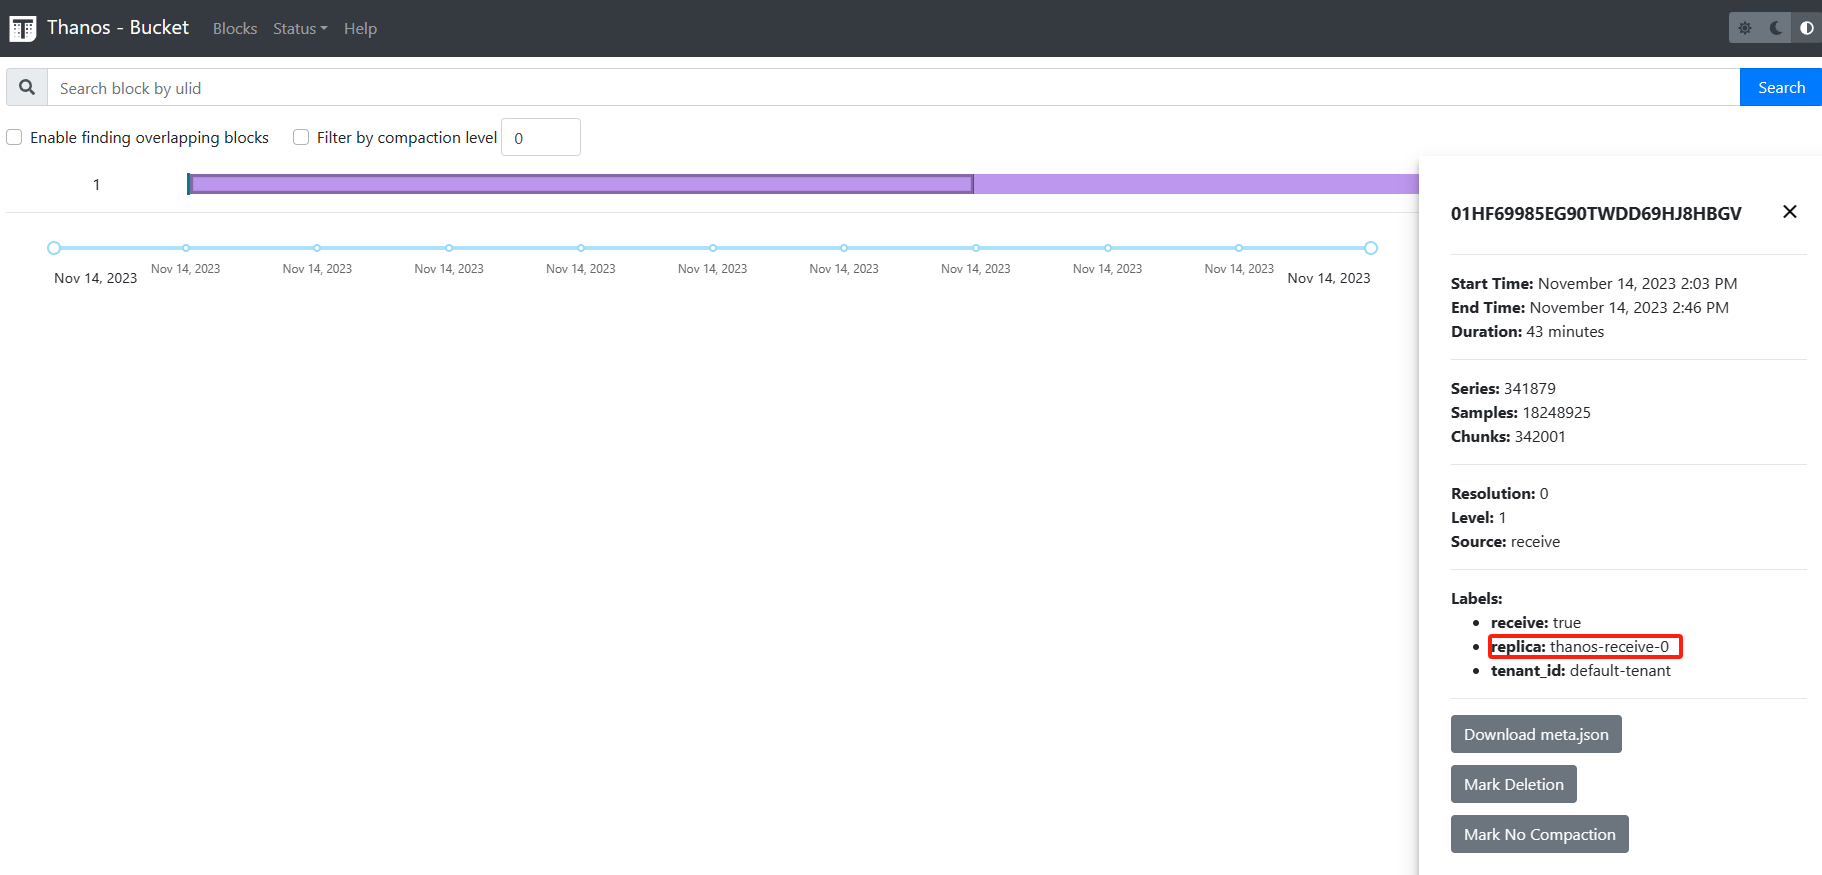
查看bucket
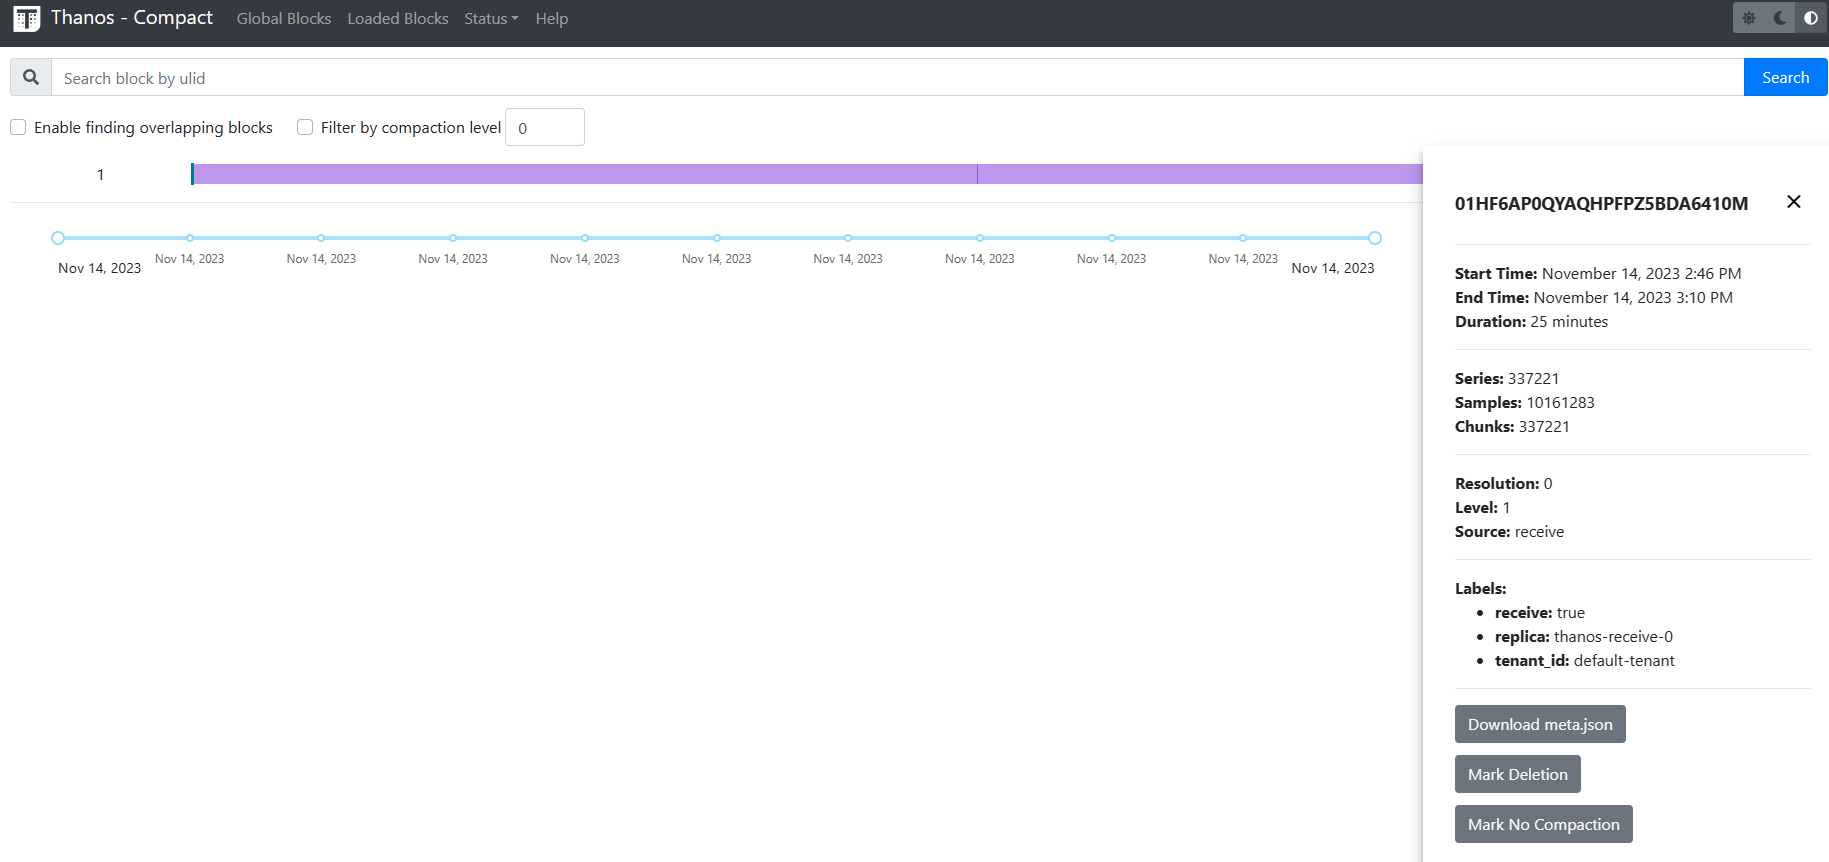
thanos-bucketweb页面中,可以查看bucket信息,点击bucket,可以下载元数据json,也可以标记为删除,标记不压缩。
查看compact
thanos-compact页面中,可以查看global和loaded 的bucket信息。
只有compactor可以对minio中的数据做删除操作。
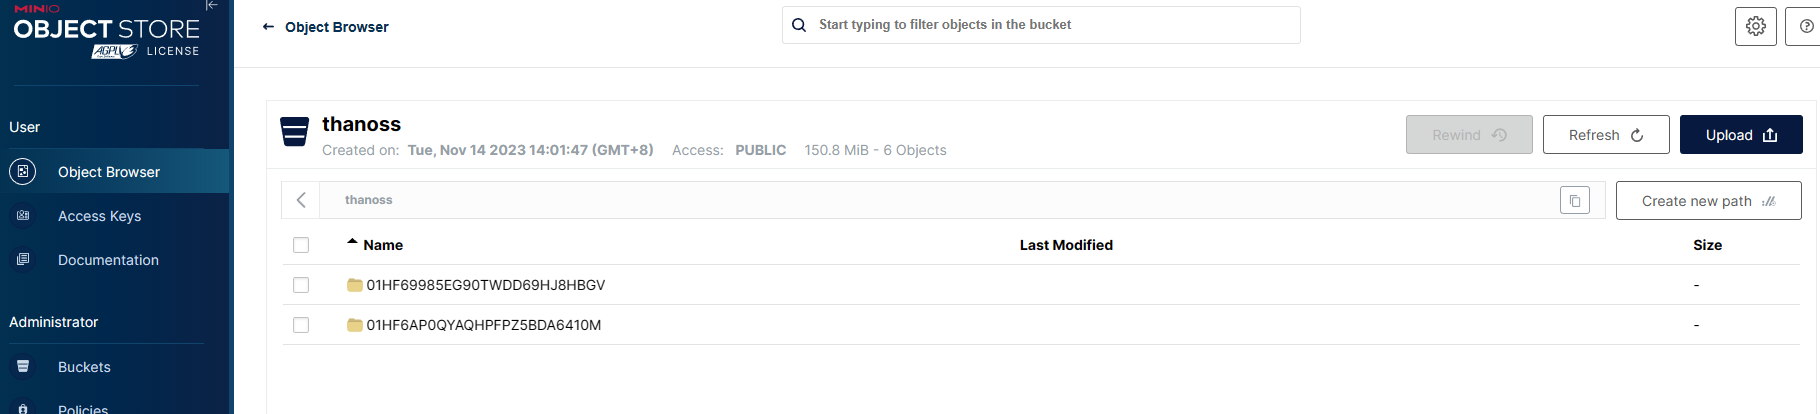
查看minio数据

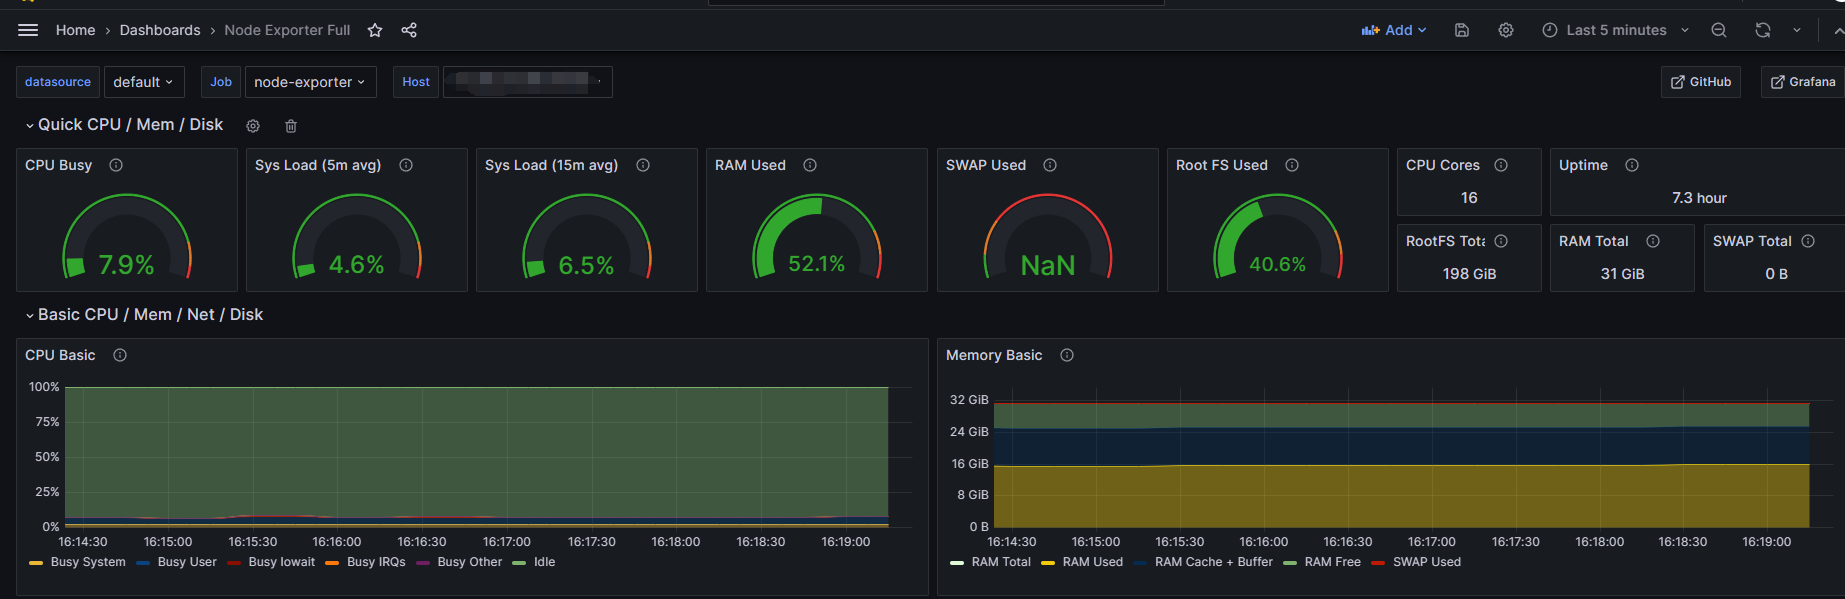
查看grafana监控
添加thanos-query数据源。

添加node-exporter模板,查看数据可以正常显示。
注意
需要添加thanos服务的limits限制,默认是没有添加的,当添加多个prometheus源时,机器会卡死,reboot都会超时。