背景
应用扩容是指在应用接收到的并发请求已经处于其处理请求极限边界的情形下,扩展处理能力而确保应用高可用的技术手段。
- Horizontal Scaling
所谓横向伸缩是指通过增加应用实例数量分担负载的方式来提升应用整体处理能力的方式。 - Vertical Scaling
所谓纵向伸缩是指通过增加单个应用实例资源以提升单个实例处理能力,进而提升应用整体处理能力的方式。


云原生下应用扩缩容都有哪些方式呢?
- HPA:Horizatontal Pod Autoscaler,规定资源使用值,最小和最大实例数量
- VPA:Vertical Pod Autoscaler,规定最小和最大资源使用量。没有生产可用,暂不介绍。
- Cluster Autoscaler:pod处于pending状态集群扩容,介绍在这里

介绍
- HPA 是 Kubernetes 的一种资源对象,能够根据某些指标对在 statefulSet、 replica Set、 deployment 等集合中的Pod 数量进行横向动态伸缩,使运行在上面的服务对指标的变化有一定的自适应能力。
- 因节点计算资源固定,当 Pod 调度完成并运行以后,动态调整计算资源变得较为困难,因此横向扩展具有更大优势,HPA 是扩展应用能力的第一选择。
- 多个冲突的 HPA 同时创建到同一个应用的时候会有无法预期的行为,因此需要小心维护 HPA规则。
- HPA 依赖于 Metrics-Server。
HPA spec
cat hpa.yaml
apiVersion: autoscaling/v2beta2
kind: HorizontalPodAutoscaler
metadata:
  name: php-apache
spec:
# HPA 的伸缩对象描述,HPA会动态修改该对象的Pod 数量
  scaleTargetRef:
    apiVersion: apps/v1
    kind: Deployment
    name: php-apache
# HPA 的最小 Pod 数量和最大 Pod 数量
  minReplicas: 1
  maxReplicas: 10
  # 监控的指标数组,支持多种类型的指标共存
  metrics:
    - type: Resource
      resource:
        name: cpu
        target:
          type: Utilization
          averageUtilization: 50
HPA 的指标类型即metrics
- 对于按 Pod 统计的资源指标(如 CPU),控制器从资源指标 API 中获取每一个HPA指定的 Pod 的度量值,如果设置了目标使用率,控制器获取每个 Pod 中的容器资源使用情况,并计算资源使用率。如果设置了 target 值,将直接使用原始数据(不再计算百分比)。
- 如果 Pod 使用自定义指标,控制器机制与资源指标类似,区别在于自定义指标只使用原始值,而不是使用率。
- 如果 Pod 使用对象指标和外部指标(每个指标描述一个对象信息)比如QPS,这个指标将直接根据目标设定值相比较,并生成一个上面提到的扩缩比例。在 autoscaling/v2beta2 版本 API中,这个指标也可以根据 Pod 数量平分后再计算。
Resource 类型的指标
- type: Resource
  resource:
        name: cpu
    # Utilization 类型的目标值,Resource 类型的指标只支持 Utilization 和 AverageValue 类型的目标值
        target:
            type: Utilization
            averageUtilization: 50
Pods 类型的指标
- type: Pods
  pods:
        metric:
            name: packets-per-second
        # AverageValue 类型的目标值,Pods 指标类型下只支持 AverageValue 类型的目标值
        target:
            type: AverageValue
            averageValue: 1k
HPA算法
按照 Pod 中所有 container 的资源使用平均值来计算,期望副本数=当前副本数 *(当前指标 / 期望指标)
当前度量值为 200m,目标设定值为 100m,那么由于 200.0/100.0== 2.0,副本数量将会翻倍。
如果当前指标为 50m,副本数量将会减半,因为 50.0/100.0== 0.5。
如果计算出的扩缩比例接近1.0(根据–horizontal-pod-autoscaler-tolerance 参数全局配置的容忍值,默认为 0.1),将会放弃本次扩缩。
滚动升级时的扩缩容
- 当你为一个 Deployment 配置自动扩缩时,你要为每个 Deployment 绑定一个HPA。
- HPA管理 Deployment 的 replicas字段。
- Deployment Controller 负责设置下层 ReplicaSet 的 replicas 字段,以便确保在上线及后续过程副本个数合适。
为什么deploymentSpec中的replicas字段的类型为*int, 而不是int?
因为replicas字段被HPA控制的时候,可能replicas不需要更新。如果使用int类型,需要给定replicas字段一个值。而使用指针类型,只需要不填replicas就可以了。
扩缩策略
扩容时:假如一个应用平时的cpu使用率是20%,突然使用率达到了100%,根据HPA的算法会使pod数量翻5倍。对基础架构和业务都有压力。
缩容时:假如pod数量是10个,需要缩容80%,如果一次性全部缩掉,业务可能会有影响。
这种情况就可以使用HPA的高级策略。
在 spec 字段的 behavior 部分可以指定一个或多个扩缩策略。
kubectl explain --api-version=autoscaling/v2beta2 hpa.spec.behavior.scaleUp
快速扩容
- 扩容时,立即新增当前9倍数量的副本数,即立即扩容到当前10倍的 Pod 数量,当然也不能超过 maxReplicas 的限制。
- pod数量:1-> 10 -> 100 -> 1000
- 没有缩容策略,即默认负载减小后5分钟开始缩容。
behavior:
    scaleUp:
      policies:
      - type: Percent
        value: 900
        periodSeconds: 5
缓慢扩容
- 每次扩容只新增 1 个 Pod
behavior:
  scaleUp:
    policies:
    - type: pods
      value: 1
缓慢缩容
- 缩容时,60秒内只能缩5个pod或者60秒内只能缩容10%的pod
behavior:
    scaleDown:
        policies:
        - type: Pods
            value: 5
            periodSeconds: 60
        - type: Percent
            value: 10
            periodSeconds: 60
这样就能保证业务的缩容是平滑的,数据指标下降也是平滑的,不是突然的下降。防止突然的流量高峰导致部分请求失败。
禁止自动缩容
- 如如果你的业务非常关键,不希望自动缩容,需要手动或者其他controller来缩容,可以设置禁止自动缩容。
behavior:
  scaleDown:
    policies:
    - type: pods
      value: 0
扩缩容灵敏度(冷却/延迟支持)
- 当使用HPA管理一组副本扩缩时,有可能因为指标动态的变化造成频繁的扩缩容,这种情况称为抖动 (Thrashing)
- –horizontal-pod-autoscaler-downscale-stabilization:设置缩容冷却时间窗口长度。默认值是5分钟
延长扩容时间窗口
- 某些大数据处理的业务,可能短时间内业务堆积,扩容出很多的pod,造成资源的浪费。我们希望可以快速扩容但是又不那么灵敏,因为即使不扩容业务也可以很快处理掉。
- 扩容时,需要先等待 5 分钟的时间窗口,如果5分钟内负载降下来了就不再扩容,如果负载持续超过扩容阀值才扩容,每次扩容新增 20 个 Pod。
behavior:
  scaleUp:
    stabilizationWindowSeconds: 300
    policies:
    - type: pods
      value: 20
延长缩容时间窗口
- 负载降下来后,等待 10 分钟再开始缩容,每次只缩容 5 个 Pod。
behavior:
scaleDown:
stabilizationWindowSeconds: 600
policies:
- type: pods
  value: 5
自定义指标
Kubernetes 默认提供 CPU 和内存作为 HPA 弹性伸缩的指标,如果有更复杂的场景需求,比如基于业务单副本 QPS 大小来进行自动扩缩容,可以安装 prometheus-adapter 来实现基于自定义指标的 Pod 扩缩容。
官方地址:https://github.com/kubernetes-sigs/prometheus-adapter
栗子
httpserver镜像,暴露了 httpserver_requests_total 指标,记录 HTTP 的请求,通过这个指标可以计算出该业务程序的 QPS 值。
部署deployment,service
apiVersion: apps/v1
kind: Deployment
metadata:
  name: httpserver
spec:
  replicas: 1
  selector:
    matchLabels:
      app: httpserver
  template:
    metadata:
      labels:
        app: httpserver
    spec:
      containers:
      - name: httpserver
        image: httpserver:v1
        imagePullPolicy: Always
---
apiVersion: v1
kind: Service
metadata:
  name: httpserver
  labels:
    app: httpserver
  annotations:
    prometheus.io/scrape: "true"
    prometheus.io/path: "/metrics"
    prometheus.io/port: "http"
spec:
  type: ClusterIP
  ports:
  - port: 80
    protocol: TCP
    name: http
  selector:
    app: httpserver
prometheus采集QPS指标
方式一:修改promtheus配置文件
如果部署的是prometheus-opreator,修改配置文件参考这里的附录
    - job_name: httpserver
      scrape_interval: 5s
      kubernetes_sd_configs:
      - role: endpoints
      relabel_configs:
      - action: keep
        source_labels:
        - __meta_kubernetes_service_label_app
        regex: httpserver
      - action: keep
        source_labels:
        - __meta_kubernetes_endpoint_port_name
        regex: http
方式二:配置 ServiceMonitor
apiVersion: monitoring.coreos.com/v1
kind: ServiceMonitor
metadata:
  name: httpserver
spec:
  endpoints:
  - port: http
    interval: 5s
  #namespaceSelector:
    #matchNames:
    #- xxx
  selector:
    matchLabels:
      app: httpserver
部署prometheus-adapter
- 通过下面的PromQL计算出每个业务 Pod 的 QPS 监控:
sum(rate(http_requests_total[2m])) by (pod) - 定义prometheus-adapter的配置
cat values.yaml rules: default: false custom: - seriesQuery: 'httpserver_requests_total' resources: template: <<.Resource>> name: matches: "httpserver_requests_total" as: "httpserver_requests_qps" # PromQL 计算出来的 QPS 指标 metricsQuery: sum(rate(<<.Series>>{<<.LabelMatchers>>}[1m])) by (<<.GroupBy>>) prometheus: url: http://prometheus.monitoring.svc.cluster.local # 替换 Prometheus API 的地址 (不写端口) port: 9090 - 部署
helm repo add prometheus-community https://prometheus-community.github.io/helm-charts helm repo update helm install prometheus-adapter prometheus-community/prometheus-adapter -f values.yaml - 查看QPS指标
kubectl get --raw /apis/custom.metrics.k8s.io/v1beta1
kubectl get --raw /apis/custom.metrics.k8s.io/v1beta1/namespaces/default/pods/*/httpserver_requests_qps
实例
metrics-server已经部署在集群中了。以php为例。
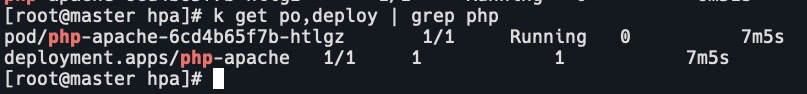
- 启动php
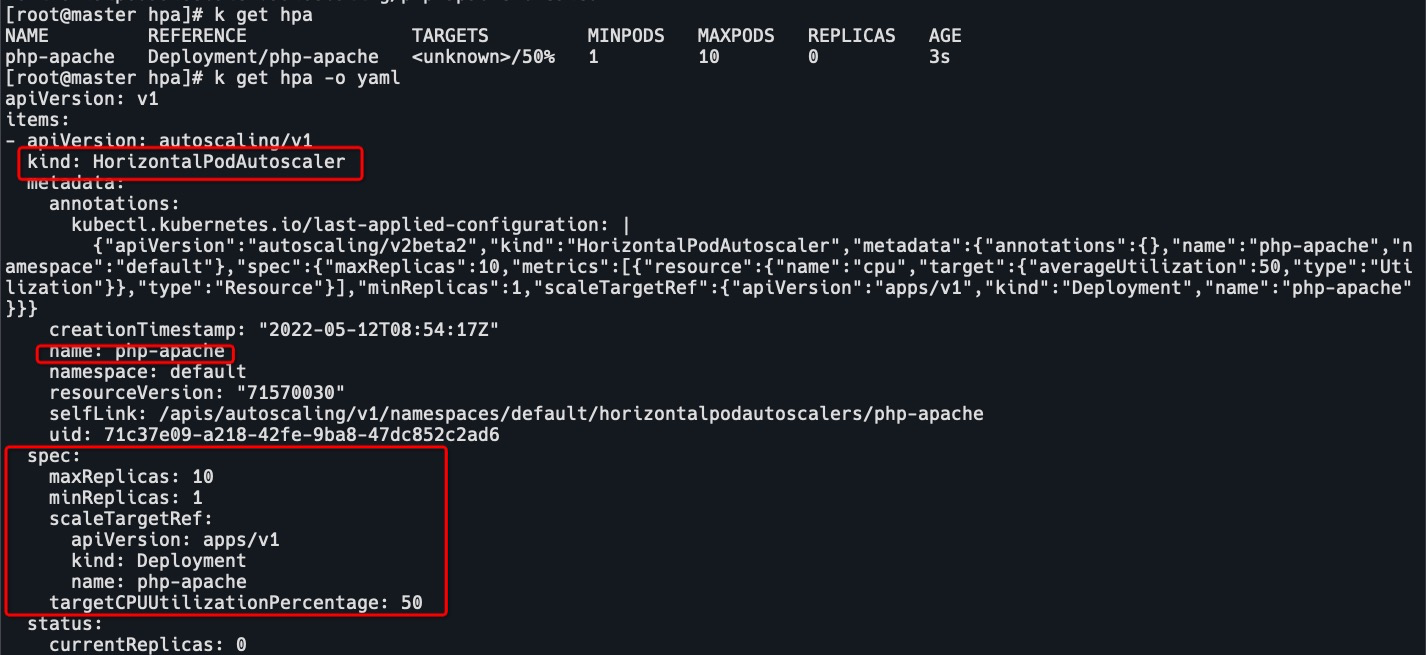
cat php-apache.yaml apiVersion: apps/v1 kind: Deployment metadata: name: php-apache spec: selector: matchLabels: run: php-apache replicas: 1 template: metadata: labels: run: php-apache spec: containers: - name: php-apache image: cncamp/hpa-example ports: - containerPort: 80 resources: limits: cpu: 500m requests: cpu: 200m --- apiVersion: v1 kind: Service metadata: name: php-apache labels: run: php-apache spec: ports: - port: 80 selector: run: php-apache k apply -f php-apache.yaml - 定义hpa规则,见上文HPA spec中的yaml。
k apply -f hpa.yaml # 或者 k autoscale deployment php-apache --cpu-percent=50 --min=1 --max=3 - 启动watch命令,观察php的负载情况
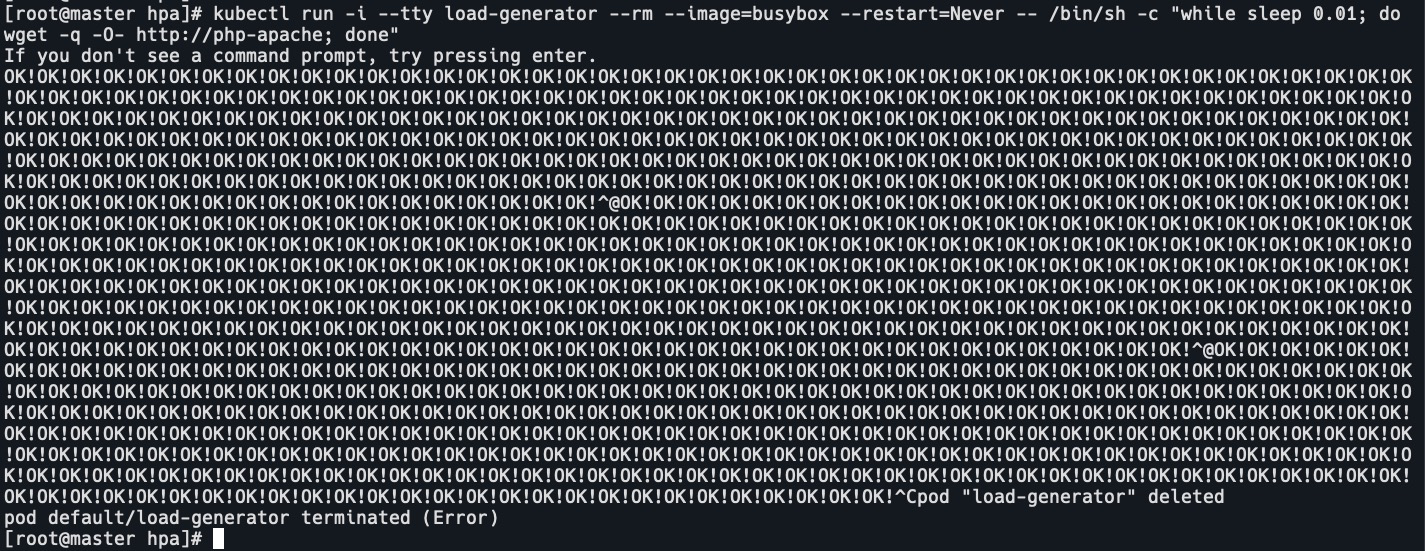
watch 'kubectl top po | grep php' - 启动busybox容器,访问php容器,加压。
kubectl run -i --tty load-generator --rm --image=busybox --restart=Never -- /bin/sh -c "while sleep 0.01; do wget -q -O- http://php-apache; done"
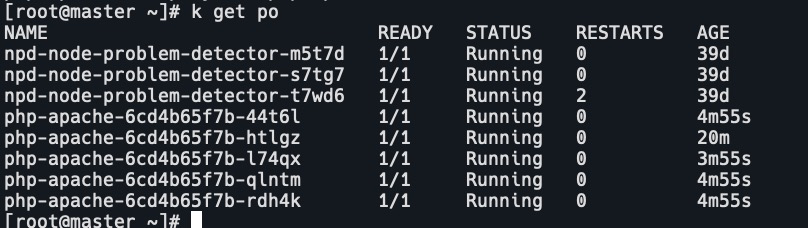
pod的cpu到达500m,pod的limits设定是500m
pod已经自动扩容
- 停止后,pod不会马上就缩容,过一会,pod数量降为1。


HPA的缺点
-
如果创建了2个hpa对象,指定了同样的target后,这2个规则会冲突,可能会出问题。
-
基于指标的弹性有滞后效应,因为弹性控制器操作的链路过长。
-
从应用负载超出國值到 HPA 完成扩容之间的时间差包括:
- 应用指标数据已经超出阈值
- HPA 定期执行指标收集滞后效应;
- HPA 控制 Deployment 进行扩容的时间;
- Pod 调度,运行时启动挂载存储和网络的时间;
- 应用启动到服务就绪的时间。
-
很可能在突发流量出现时,还没完成弹性扩容,服务实例已经被流量击垮。
可能遇到的问题
由于hpa是按照 Pod 中所有 container 的资源使用平均值来计算的,如果 Pod 中有多个 container,它们的资源使用相差较大,可能导致某个 container 高负载了还不扩容。
比如有个pod,它有2个容器,一个是业务容器,一个是sidecar,业务容器CPU使用为100%,而sidecar容器CPU使用为0,那么这个pod CPU使用率就会被当作50%,而hpa设置的CPU阈值是60%,那么这个pod就不会被扩容。
如何解决
- 使用vpa,根据容器实际使用的资源大小来动态调整容器的 request/limit,使得hpa计算出来的平均值能够比较客观反映 pod的整体负载情况。
- 在k8s 1.20版本以后有一个hpa的增强特性:Container HPA。
参考地址:https://github.com/kubernetes/enhancements/tree/master/keps/sig-autoscaling/1610-container-resource-autoscaling
它允许hpa根据容器使用的资源来进行扩缩容。kubectl explain --api-version=autoscaling/v2beta2 hpa.spec.metrics.containerResource
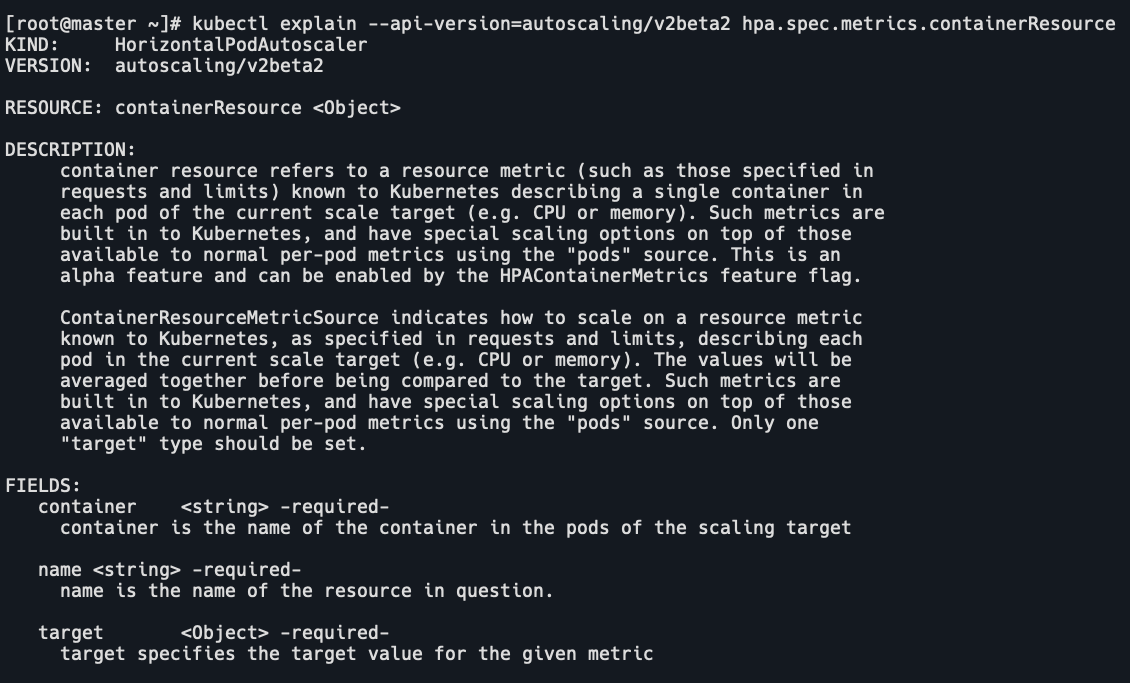
一个栗子:
pod有2个容器:application和log。当application容器的CPU使用率达到50%即进行扩容,并且不管log容器CPU使用率;或者pod整体的CPU使用率达到50%进行扩容。
apiVersion: autoscaling/v2beta2
kind: HorizontalPodAutoscaler
metadata:
  name: mission-critical
spec:
  scaleTargetRef:
    apiVersion: apps/v1
    kind: Deployment
    name: mission-critical
  minReplicas: 1
  maxReplicas: 10
  metrics:
  - type: ContainerResource
    resource:
      name: cpu
      container: application
      target:
        type: Utilization
        averageUtilization: 50
  - type: PodResource
    resource:
      name: cpu
      target:
        type: Utilization
        averageUtilization: 50