背景
PodMonitor 和 ServiceMonitor 就是 exporter 的各种抽象,是用来提供专门提供指标数据接口的工具。
- ServiceMonitor 要求被监控的服务必须有对应的 Service,而 PodMonitor 则不需要,此处选择使用 PodMonitor 来采集 Felix 的指标。
- PodMonitor 虽然不需要应用创建相应的 Service,但必须在 Pod 中指定指标的端口和名称。
下面以prometheus监控calico为例
步骤
- 查看calico的ds
k get ds -n calico-system
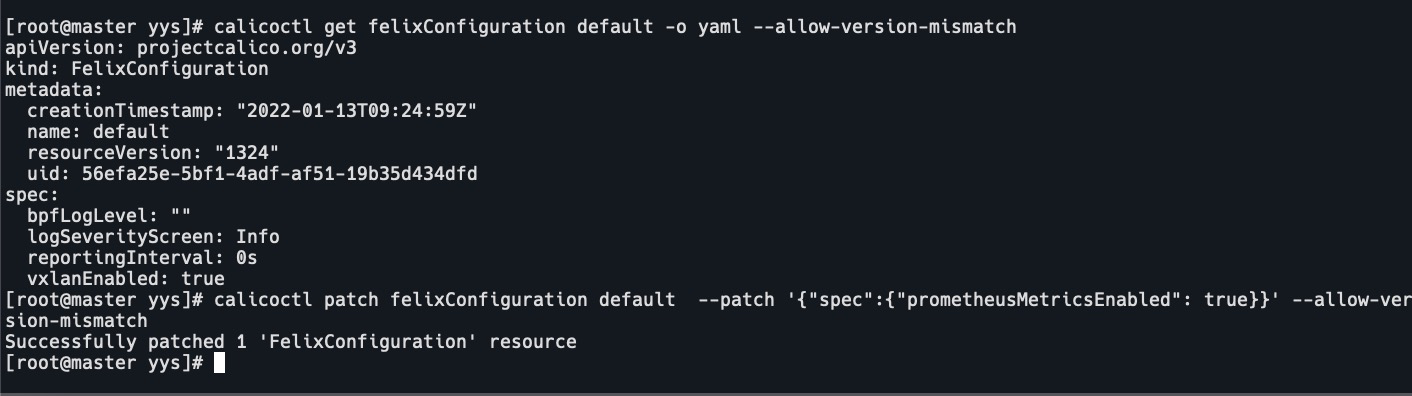
- 使用calicoctl,开启metrics端口
calicoctl get felixConfiguration default -o yaml --allow-version-mismatch calicoctl patch felixConfiguration default --patch '{"spec":{"prometheusMetricsEnabled": true}}' - 查看calico指标
curl -s http://localhost:9091/metrics - 修改ds的配置,指定端口和名称
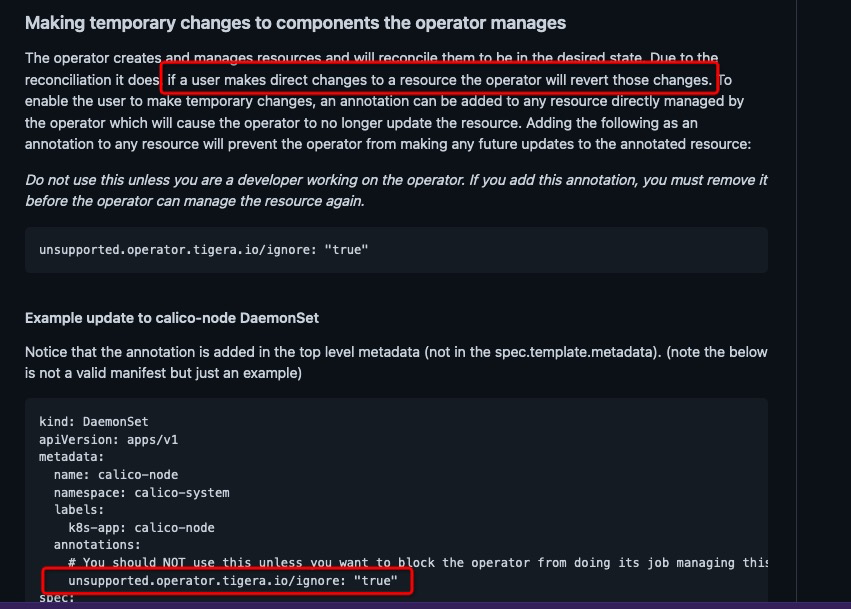
ports:
- containerPort: 9091
name: http-metrics
protocol: TCP
注意这里如果calico是用官方的calico-opreator部署的,ds修改是不成功的。需要添加annotations:
unsupported.operator.tigera.io/ignore: "true" - 添加annotations,再次修改ds成功。
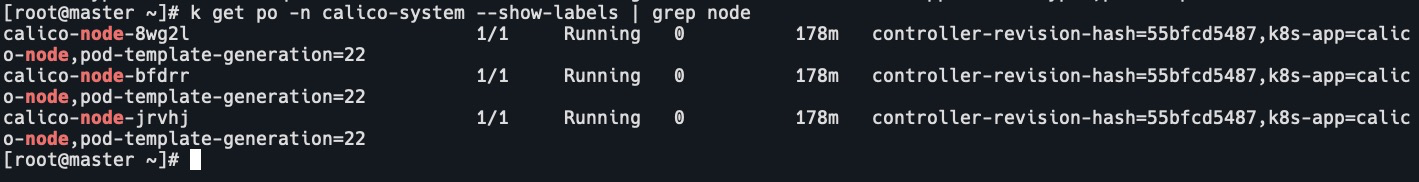
- 查看calico-node的labels
k get po -n calico-system --show-labels | grep calico-node - 设置podMonitor
vim calico-podmonitor.yaml
apiVersion: monitoring.coreos.com/v1
kind: PodMonitor
metadata:
labels:
k8s-app: calico-node
name: felix
namespace: thanos
spec:
podMetricsEndpoints:
- interval: 15s
path: /metrics
port: http-metrics
namespaceSelector:
matchNames:
- calico-system
selector:
matchLabels:
  k8s-app: calico-node
k apply -f calico-podmonitor.yaml
PodMonitor 的 name 最终会反应到 Prometheus 的配置中,作为 job_name。
podMetricsEndpoints.port 需要和被监控的 Pod 中的 ports.name 相同,此处为 http-metrics。
namespaceSelector.matchNames 需要和被监控的 Pod 所在的 namespace 相同,此处为 calico-system。
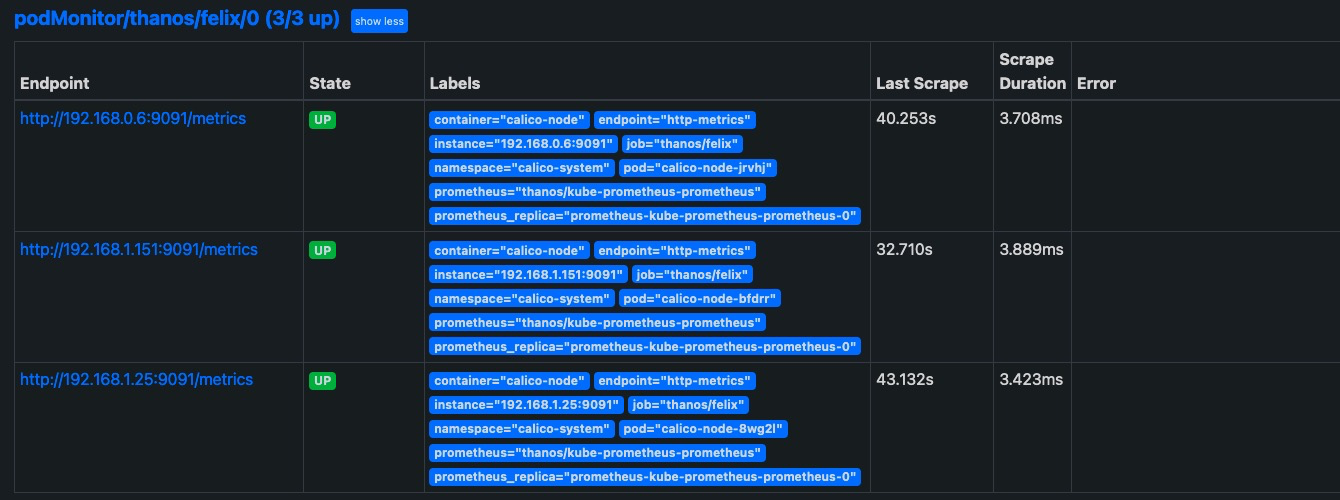
selector.matchLabels 的标签必须和被监控的 Pod 中能唯一标明身份的标签对应。 - 安全组中添加9091端口,prometheus页面查看target
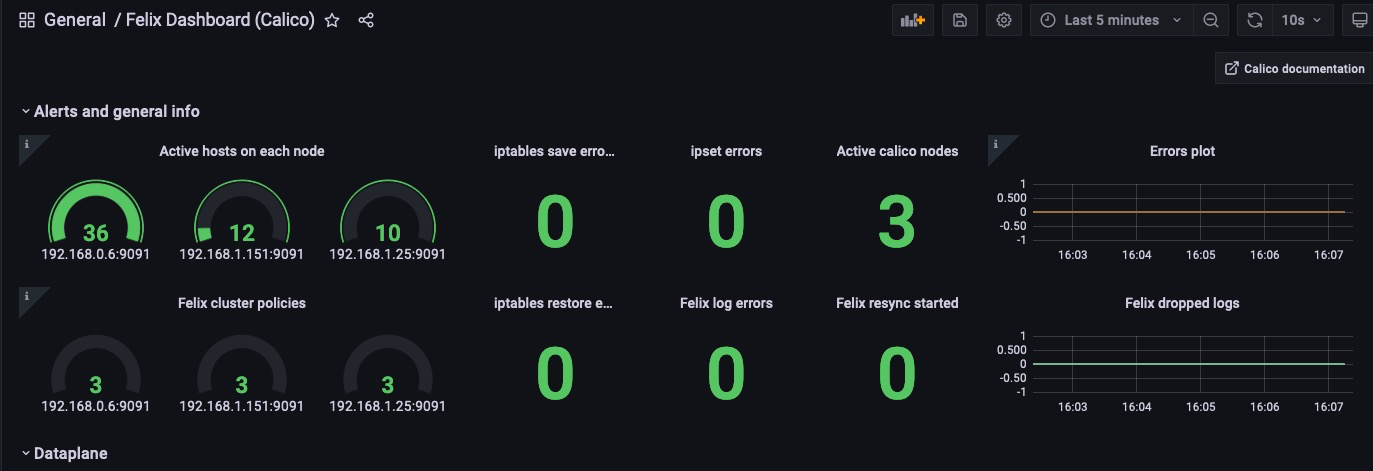
- 查看grafana


附:修改prometheus配置
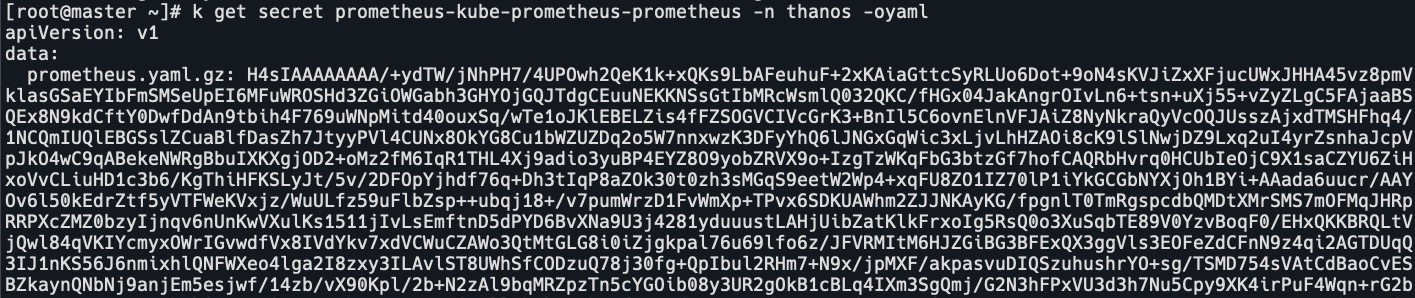
查看当前 prometheus 配置(同 Prometheus 控制台,Status > Configuration)
kubectl get secret -n thanos prometheus-kube-prometheus-prometheus -o json | jq -r '.data."prometheus.yaml.gz"' | base64 -d | gzip -d可以通过从 secret base64 解码,解压,导出 prometheus.yaml, 让后修改后在压缩,base64 编码,edit secret 更新保存的方法修改prometheus配置。
kubectl get secret -n thanos prometheus-kube-prometheus-prometheus  -o json | jq  -r '.data."prometheus.yaml.gz"' | base64 -d | gzip -d > prometheus.yaml
## 修改 vim prometheus.yaml 文件,修改配置文件。
gzip prometheus.yaml
base64 prometheus.yaml.gz -w 0 ## -w 0 表示不换行,不成块
kubectl edit secret -n thanos prometheus-kube-prometheus-prometheus  ## copy 之前 base64 prometheus.yaml.gz -w 0 编码后的值,替换  prometheus.yaml.gz: 的值
## 保存后可再次查看

# 必要时重启生效 kubectl replace --force -f prometheus.yaml  or kubectl delete pod -n thanos prometheus-kube-prometheus-prometheus-0